Bitcoin Price Bounce at Risk: Is the Recovery About to Fade?
Bitcoin price started a recovery wave from the $55,600 zone. BTC is now struggling to clear the $58,500 resistance and might decline again. Bitcoin is struggling to recover above the $58,500 zone. The price is trading be...
Archive context
Older archive item. Useful for background and entity history, but not a fresh market-moving signal.

Bitcoin price started a recovery wave from the $55,600 zone. BTC is now struggling to clear the $58,500 resistance and might decline again.
- Bitcoin is struggling to recover above the $58,500 zone.
- The price is trading below $58,200 and the 100 hourly Simple moving average.
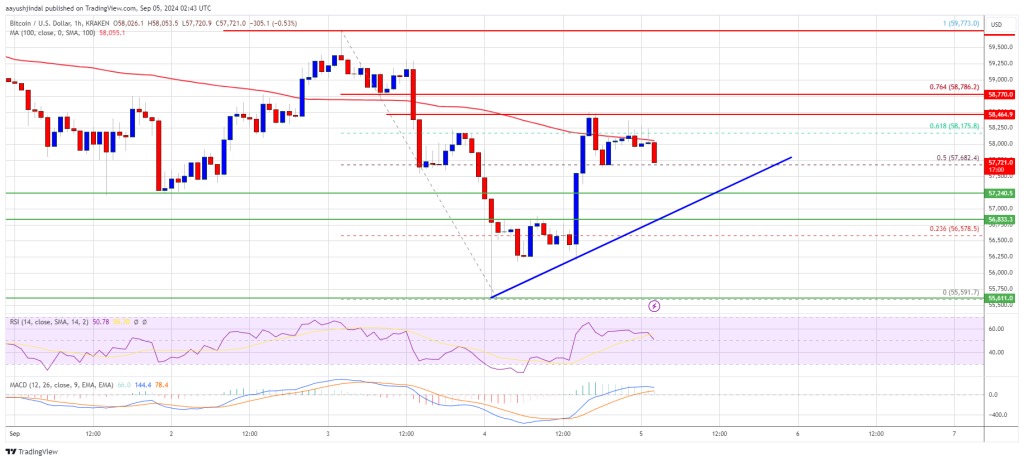
- There is a connecting bullish trend line forming with support at $57,250 on the hourly chart of the BTC/USD pair (data feed from Kraken).
- The pair could struggle to recover above the $58,500 or $58,750 resistance levels in the near term.
Bitcoin price extended losses below the $57,200 support level. BTC even traded below the $57,000 support. A low was formed at $55,591 and the price recently started a recovery wave.
There was a move above the $56,500 and $57,000 resistance levels. It cleared the 50% Fib retracement level of the downward move from the $59,772 swing high to the $55,591 low. The price even cleared the $58,000 level but faced sellers near $58,500.
Bitcoin is now trading below $58,200 and the 100 hourly Simple moving average. There is also a connecting bullish trend line forming with support at $57,250 on the hourly chart of the BTC/USD pair.
On the upside, the price could face resistance near the $58,500 level. The first key resistance is near the $58,750 level or the 76.4% Fib retracement level of the downward move from the $59,772 swing high to the $55,591 low. A clear move above the $58,750 resistance might send the price further higher in the coming sessions.
The next key resistance could be $59,500. A close above the $59,500 resistance might spark more upsides. In the stated case, the price could rise and test the $60,000 resistance.
Another Decline In BTC?If Bitcoin fails to rise above the $58,500 resistance zone, it could start another decline. Immediate support on the downside is near the $57,250 level and the trend line.
The first major support is $56,850. The next support is now near the $56,200 zone. Any more losses might send the price toward the $55,500 support in the near term.
Technical indicators:
Hourly MACD – The MACD is now losing pace in the bullish zone.
Hourly RSI (Relative Strength Index) – The RSI for BTC/USD is now near the 50 level.
Major Support Levels – $57,250, followed by $56,850.
Major Resistance Levels – $58,500, and $58,750.
Why this matters
This bitcoin story adds another data point to the current market tape and is useful when read alongside nearby source coverage.
Original source
Read on NewsBTCRelated market context

Ethereum (ETH) Price Prediction: ETH Holds Near $1,780 as Bulls Eye $1,860–$1,950, but $1,609 Remains Key Invalidation
Ethereum price is trading near $1,779 after a mixed 24-hour session, according to Brave New Coin data. ETH is down around 0.76% on...

Solana Price Prediction: SOL Holds Near $81 as Breakout Setup Points to $87, but Whale Flows Keep Risk Active
Solana price is back in focus after a sharp recovery pushed SOL towards the $81 area. The move has improved short-term momentum, e...

Bitcoin Price Eyes Recovery After END-OF-CYCLE STRC Shock, Bitwise CIO Says Strategy Will Be ‘Less Important’ Next BTC Cycle
While improving macroeconomic conditions have supported a modest Bitcoin price rebound, Bitwise Chief Investment Officer Matt Houg...

XRP Price Prediction: SuperTrend Buy Signal Meets Shrinking Supply as $1.24 Breakout Comes Into Focus
After a fresh SuperTrend buy signal appeared on the 4-hour chart, analysts are watching whether the XRP price can extend its recen...

Bitcoin whales send 49,000 BTC to exchanges as $60K rebound shows signs of weakness
Bitcoin’s recovery above $60,000 is facing a fresh test from exchange-flow and derivatives data after large holders moved one of t...

Ether leads crypto's hold above key levels as bitcoin steadies over $63,000
A stalling rebound in AI and chip stocks and a stronger dollar kept the mood cautious as the second half gets underway.