Bitcoin Price Bounce Weakens, Recovery at Risk of Fading Again
Bitcoin price started a recovery wave from $68,000. BTC is now back above $70,000 and might struggle to continue higher in the near term. Bitcoin started a decent recovery wave above $69,500 and $70,000. The price is tra...

Bitcoin price started a recovery wave from $68,000. BTC is now back above $70,000 and might struggle to continue higher in the near term.
- Bitcoin started a decent recovery wave above $69,500 and $70,000.
- The price is trading above $70,000 and the 100 hourly simple moving average.
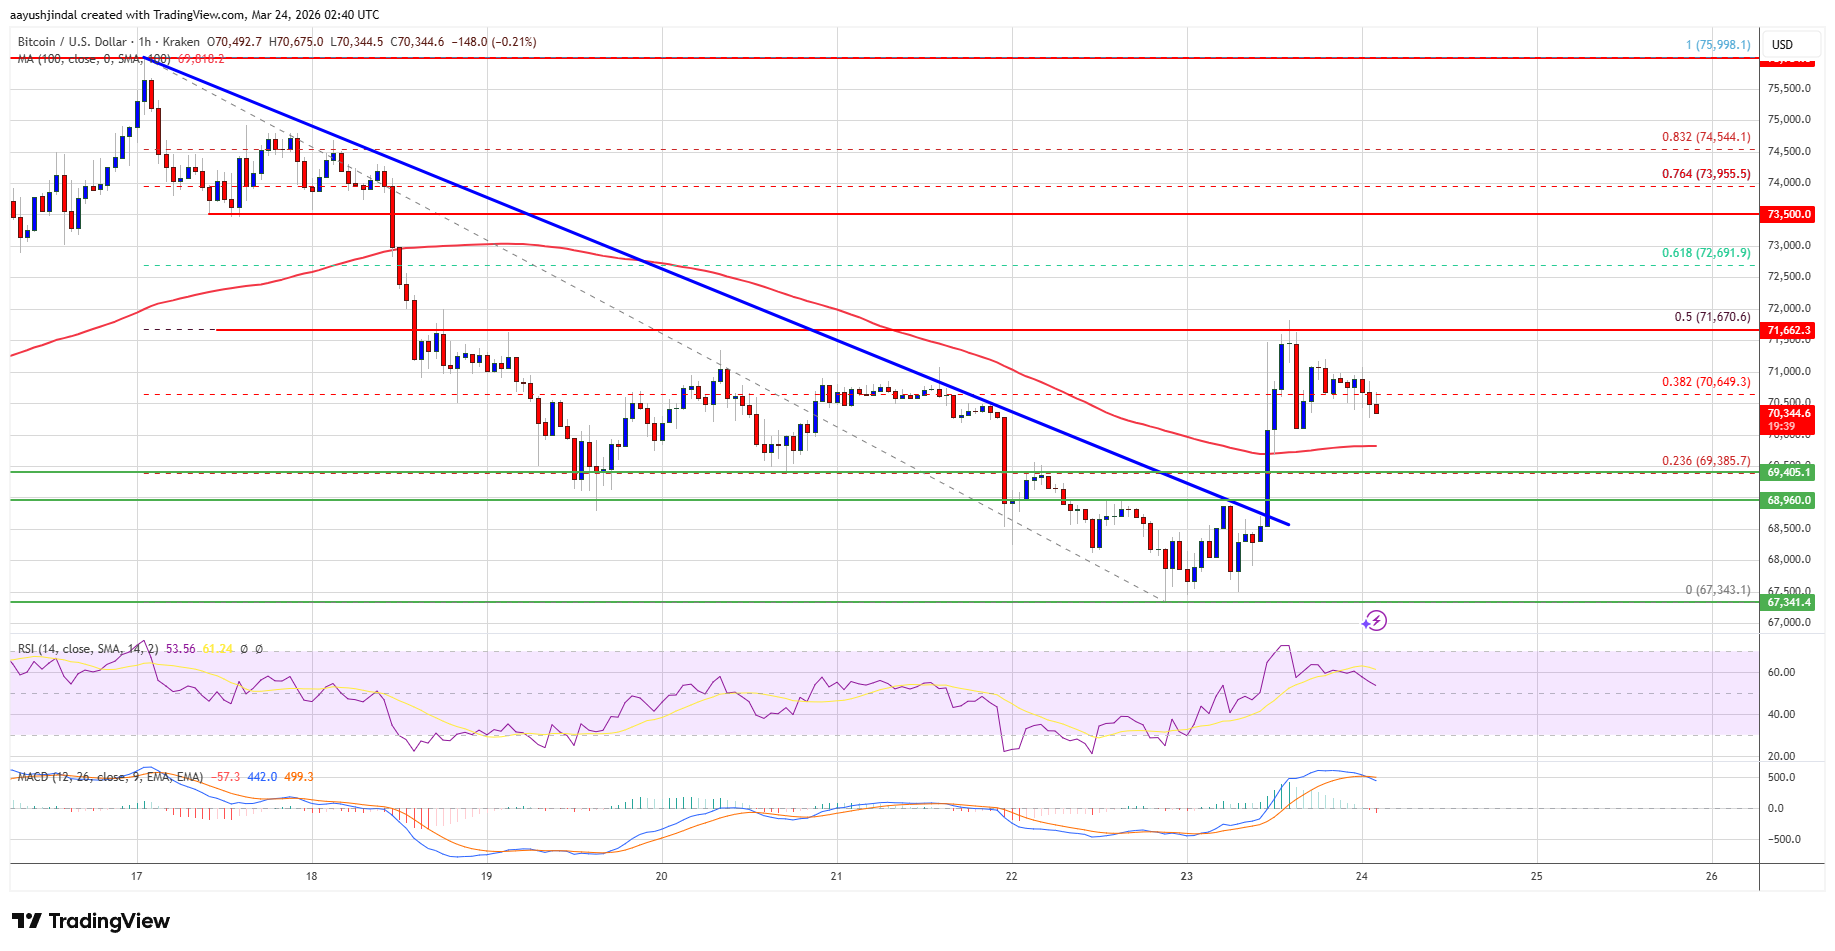
- There was a break above a bearish trend line with resistance at $69,500 on the hourly chart of the BTC/USD pair (data feed from Kraken).
- The pair might start another decline if it stays below the $71,500 and $72,000 levels.
Bitcoin price found support near the $67,500 zone and recently started a recovery wave. BTC climbed above the $68,800 and $69,500 resistance levels.
There was a break above a bearish trend line with resistance at $69,500 on the hourly chart of the BTC/USD pair. The bulls were able to push the price above the 38.2% Fib retracement level of the downward move from the $75,999 swing high to the $67,343 low.
However, the price faced resistance near the $71,500 zone and the 50% Fib retracement level of the downward move from the $75,999 swing high to the $67,343 low. Bitcoin is now trading above $70,000 and the 100 hourly simple moving average.
If the price remains stable above $70,000, it could attempt a fresh increase. Immediate resistance is near the $71,650 level. The first key resistance is near the $72,000 level. A close above the $72,000 resistance might send the price further higher.
In the stated case, the price could rise and test the $73,500 resistance. Any more gains might send the price toward the $74,200 level. The next barrier for the bulls could be $75,000.
Another Decline In BTC?If Bitcoin fails to rise above the $71,650 resistance zone, it could start another decline. Immediate support is near the $70,000 level. The first major support is near the $69,350 level.
The next support is now near the $68,950 zone. Any more losses might send the price toward the $68,000 support in the near term. The main support now sits at $67,500, below which BTC might struggle to recover in the near term.
Technical indicators:
Hourly MACD – The MACD is now losing pace in the bullish zone.
Hourly RSI (Relative Strength Index) – The RSI for BTC/USD is now above the 50 level.
Major Support Levels – $68,950, followed by $68,000.
Major Resistance Levels – $71,650 and $72,000.
Original source
Read on NewsBTCRelated market context

Bitcoin (BTC) Price Prediction: BTC Eyes $70K Liquidity Sweep as Whales Reclaim Control Near $62K
Market data suggests that long-term holders remain largely inactive, while whale activity is beginning to recover, creating an int...

Bitcoin’s $60,000 support is still a bet on the dollar breaking
Glassnode's latest Week On-chain report says Bitcoin has entered a deep discount phase, with over 95% of short-term holders underw...

Kraken Becomes Official Crypto Exchange Supporter Of FIFA World Cup 2026
TL;DR Kraken says it has become the Official Crypto Exchange Supporter of the FIFA World Cup 2026. The tournament expands to 48 te...

The 3-Part Impulse That Shows Where The XRP Price Is Headed Next
XRP bulls are trying to turn a brutal selloff into something bigger than a relief bounce. An interesting setup shows a possible th...

Most Traders Will Scroll Past This Grok AI Bitcoin Predicts, Big Mistake
Elon Musk Grok AI just looked at a Bitcoin chart down more than 50% and predicts it’s a classic accumulation zone, targeting $150,...

Paraguay faces United States in 2026 World Cup opener as Kraken becomes FIFA’s official crypto exchange supporter
The integration of crypto in global sports events like the World Cup could accelerate digital currency adoption and reshape fan en...