Bitcoin Price Cracks $80K Support—Is a Deeper Correction Coming?
Bitcoin price started a fresh decline from the $90,000 zone. BTC is back below $82,500 and might continue to move down below $78,000. Bitcoin started a fresh decline below the $82,000 zone. The price is trading below $80...
Archive context
Older archive item. Useful for background and entity history, but not a fresh market-moving signal.

Bitcoin price started a fresh decline from the $90,000 zone. BTC is back below $82,500 and might continue to move down below $78,000.
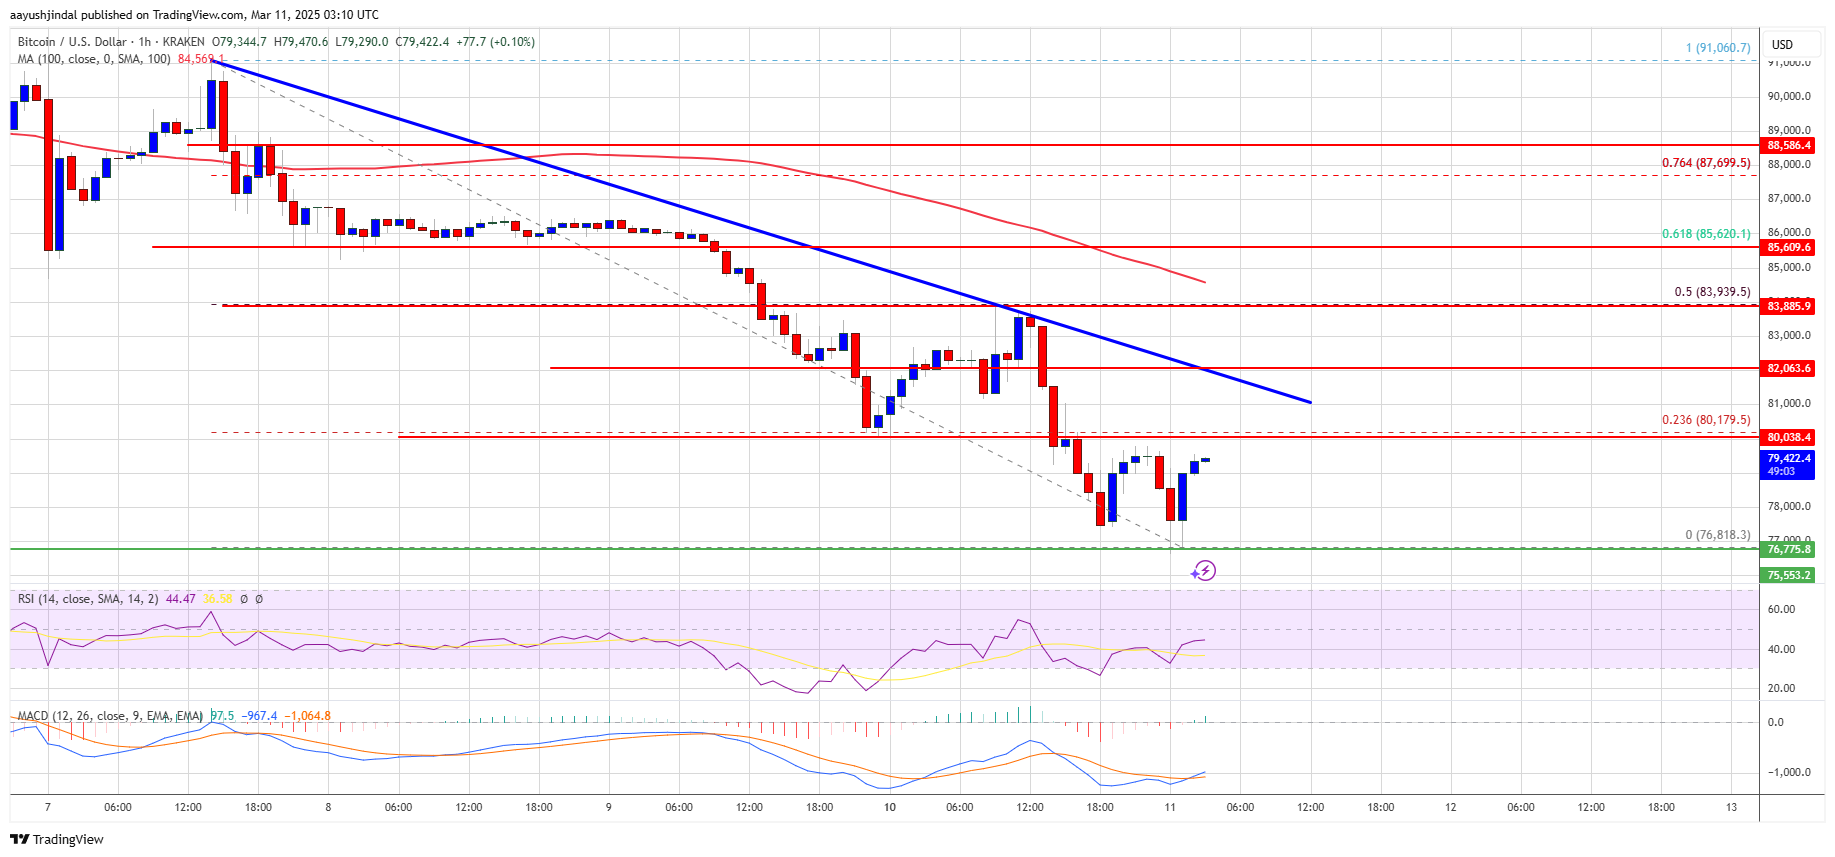
- Bitcoin started a fresh decline below the $82,000 zone.
- The price is trading below $80,000 and the 100 hourly Simple moving average.
- There is a key bearish trend line forming with resistance at $82,200 on the hourly chart of the BTC/USD pair (data feed from Kraken).
- The pair could start another decline if it fails to clear the $82,000 resistance zone.
Bitcoin price started a fresh decline below the $85,000 level. BTC traded below the $83,000 and $80,000 support levels. Finally, the price tested the $76,500 support zone.
A low was formed at $76,818 and the price recently started a consolidation phase. There was a move above the $78,000 and $78,500 resistance levels. The bulls pushed the price toward the 23.6% Fib retracement level of the downward move from the $91,060 swing high to the $76,818 low.
Bitcoin price is now trading below $80,000 and the 100 hourly Simple moving average. On the upside, immediate resistance is near the $80,200 level. The first key resistance is near the $82,000 level.
There is also a key bearish trend line forming with resistance at $82,200 on the hourly chart of the BTC/USD pair. The next key resistance could be $84,000. It is near the 50% Fib retracement level of the downward move from the $91,060 swing high to the $76,818 low.
A close above the $84,000 resistance might send the price further higher. In the stated case, the price could rise and test the $85,500 resistance level. Any more gains might send the price toward the $88,000 level or even $96,200.
Another Drop In BTC?If Bitcoin fails to rise above the $82,000 resistance zone, it could start a fresh decline. Immediate support on the downside is near the $77,200 level. The first major support is near the $76,500 level.
The next support is now near the $75,000 zone. Any more losses might send the price toward the $72,000 support in the near term. The main support sits at $70,000.
Technical indicators:
Hourly MACD – The MACD is now losing pace in the bearish zone.
Hourly RSI (Relative Strength Index) – The RSI for BTC/USD is now below the 50 level.
Major Support Levels – $76,500, followed by $75,000.
Major Resistance Levels – $80,000 and $82,000.
Why this matters
This bitcoin story adds another data point to the current market tape and is useful when read alongside nearby source coverage.
Original source
Read on NewsBTCRelated market context

Bitcoin (BTC) Price Today: Michael Saylor’s Strategy Reports $8.3B Loss as BTC Slides Below $64K
The BTC move comes shortly after Strategy reported an $8.33 billion operating loss for the second quarter of 2026, including an $8...

If Bitcoin breaks $62k over the weekend, a $1.1B short overhang stands ready to pull price down to $60k
Bitcoin enters the weekend near $62,900, less than 1% above the July 31 intraday low, and Deribit has already settled roughly $9.6...

Sam Altman ChatGPT AI Predicts a Historic XRP Price Move Before End of 2026
ChatGPT AI predicts a multi-year breakout for XRP, with the price prediction extending all the way to the end of 2027. From today’...

Bitcoin hashrate decline nears 287 days as miner stocks surge
The shift from Bitcoin mining to AI hosting highlights a strategic pivot, potentially stabilizing revenue but increasing market co...

Ripple Just Got Full MiCA Authorization in Europe But Fed’s Hawkish Tone Is Keeping XRP Capped at $1.10
In the latest XRP News, XRP price is trading at $1.07, down 0.57% in the last 24 hours, as the asset continues to wrestle with the...

Bitcoin Price Prediction: $10 Billion of BTC and ETH Option Expiry Hitting the Market Today
The largest single-day options expiry in recent months is clearing today, and the market is already pricing in the friction. Bitco...