Bitcoin Price Decline Continues: Lower Targets in Sight
Bitcoin price started another decline from the $66,850 resistance zone. BTC is again moving lower and might even decline below the $65,500 support zone. Bitcoin failed to climb above $67,000 and started another decline....
Archive context
Older archive item. Useful for background and entity history, but not a fresh market-moving signal.

Bitcoin price started another decline from the $66,850 resistance zone. BTC is again moving lower and might even decline below the $65,500 support zone.
- Bitcoin failed to climb above $67,000 and started another decline.
- The price is trading below $66,800 and the 100 hourly Simple moving average.
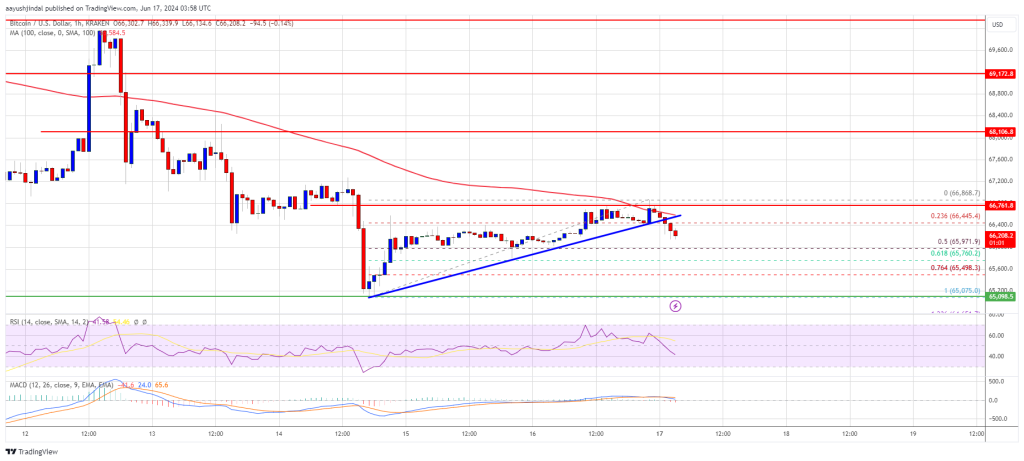
- There was a break below a connecting bullish trend line with support at $66,500 on the hourly chart of the BTC/USD pair (data feed from Kraken).
- The pair could continue to move down and even trade below the $65,500 support zone.
Bitcoin price struggled to climb above the $67,000 resistance zone. BTC remained in a bearish zone and started a fresh decline from the $66,868 high. There was a move below the $66,500 level.
Besides, there was a break below a connecting bullish trend line with support at $66,500 on the hourly chart of the BTC/USD pair. The pair traded below the 23.6% Fib retracement level of the upward move from the $65,075 swing low to the $66,868 high.
Bitcoin is now trading below $66,800 and the 100 hourly Simple moving average. It seems like the price might soon test the 50% Fib retracement level of the upward move from the $65,075 swing low to the $66,868 high.
On the upside, the price is facing resistance near the $66,500 level and the 100 hourly Simple moving average. The first major resistance could be $66,850. The next key resistance could be $67,000. A clear move above the $67,000 resistance might start a decent increase and send the price higher.
In the stated case, the price could rise and test the $66,000 resistance. Any more gains might send BTC toward the $68,500 resistance in the near term.
More Losses In BTC?If Bitcoin fails to climb above the $66,500 resistance zone, it could continue to move down. Immediate support on the downside is near the $66,000 level.
The first major support is $65,750. The next support is now forming near $65,500. Any more losses might send the price toward the $65,000 support zone in the near term.
Technical indicators:
Hourly MACD – The MACD is now gaining pace in the bearish zone.
Hourly RSI (Relative Strength Index) – The RSI for BTC/USD is now below the 50 level.
Major Support Levels – $66,500, followed by $65,000.
Major Resistance Levels – $66,500, and $67,000.
Why this matters
This bitcoin story adds another data point to the current market tape and is useful when read alongside nearby source coverage.
Original source
Read on NewsBTCRelated market context

Bitcoin (BTC) Price Prediction: BTC Holds $63K Support—Can Rising Active Addresses Offset Bearish Technical Signals?
Although the BTC price has remained near a key support zone, recent chart signals and Strategy’s sale of a portion of its Bitcoin...

Bitcoin price rebounds to $63K as leverage returns creating short term volatility risk
Bitcoin's rebound has cleared the first test: price recovered. The harder one starts now: proving buyers remain after the squeeze....

Bitcoin miner bottom signal now depends on who survives weak mining profits
A Bitcoin miner-stress signal circulating on X has fallen into a zone analysts associate with severe miner pressure, putting a fam...

Sui DeFi TVL Breaks $1 Billion As Move-Based Chains Fight For Liquidity
Sui has crossed the $1 billion total value locked mark on DeFiLlama, giving the Move-based network a clearer claim to serious DeFi...

Strategy faces $8.3 billion Bitcoin Q2 loss as Saylor sells over $200M in BTC
Strategy’s largest Bitcoin sale in years has put new pressure on the corporate treasury model that made Michael Saylor one of the...

Coinbase World Cup error shows prediction markets still have a proof problem
A reported Coinbase announcement about a World Cup result, likely using AI, created a problem bigger than a flawed alert. It showe...