Bitcoin Price Flashes Downside Break: Will Bears Take Over?
Bitcoin price failed to clear the $60,650 resistance. BTC is now correcting gains and might decline toward the $57,500 support zone. Bitcoin is correcting gains and trading well below the $60,000 level. The price is trad...
Archive context
Older archive item. Useful for background and entity history, but not a fresh market-moving signal.

Bitcoin price failed to clear the $60,650 resistance. BTC is now correcting gains and might decline toward the $57,500 support zone.
- Bitcoin is correcting gains and trading well below the $60,000 level.
- The price is trading below $58,800 and the 100 hourly Simple moving average.
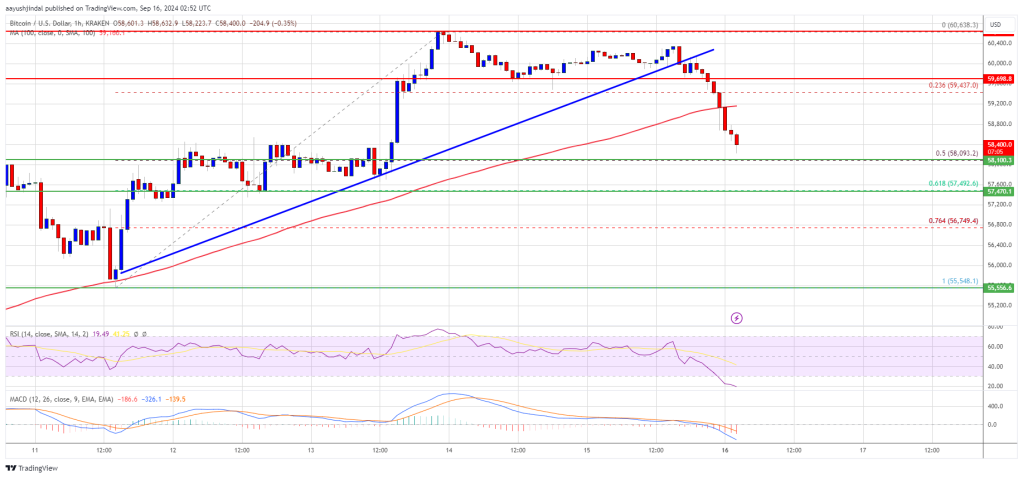
- There was a break below a key bullish trend line with support at $60,000 on the hourly chart of the BTC/USD pair (data feed from Kraken).
- The pair could climb again if it stays above the $57,500 support zone.
Bitcoin price started a decent increase after it broke the $58,500 resistance zone. BTC was able to climb above the $59,500 resistance. The pair even cleared the $60,000 resistance zone.
However, the bears seem to be active near the $60,650 resistance zone. A high was formed at $60,638 and the price is now correcting gains. There was a drop below the $59,500 level. The price even dipped below the 23.6% Fib retracement level of the upward move from the $55,548 swing low to the $60,638 high.
There was also a break below a key bullish trend line with support at $60,000 on the hourly chart of the BTC/USD pair. Bitcoin is now trading below $58,800 and the 100 hourly Simple moving average.
On the upside, the price could face resistance near the $59,200 level. The first key resistance is near the $60,000 level. A clear move above the $60,000 resistance might start a steady increase in the coming sessions. The next key resistance could be $60,650. A close above the $60,650 resistance might spark more upsides. In the stated case, the price could rise and test the $62,000 resistance.
More Downsides In BTC?If Bitcoin fails to rise above the $59,200 resistance zone, it could continue to move down. Immediate support on the downside is near the $58,000 level or the 50% Fib retracement level of the upward move from the $55,548 swing low to the $60,638 high.
The first major support is $57,500. The next support is now near the $56,750 zone. Any more losses might send the price toward the $55,550 support in the near term.
Technical indicators:
Hourly MACD – The MACD is now gaining pace in the bearish zone.
Hourly RSI (Relative Strength Index) – The RSI for BTC/USD is now below the 50 level.
Major Support Levels – $58,000, followed by $57,500.
Major Resistance Levels – $59,200, and $60,000.
Why this matters
This bitcoin story adds another data point to the current market tape and is useful when read alongside nearby source coverage.
Original source
Read on NewsBTCRelated market context

Solana Price Prediction: SOL Holds Near $81 as Breakout Setup Points to $87, but Whale Flows Keep Risk Active
Solana price is back in focus after a sharp recovery pushed SOL towards the $81 area. The move has improved short-term momentum, e...

Leading Claude AI Fable 5 Predicts Stunning XRP Price by The End of 2026
Anthropic’s new Claude AI model, Fable 5, predicts XRP price for the entire second half around a single event that could be resolv...

Hyperliquid (HYPE) Price Prediction: Symmetrical Triangle Breakout Puts $77 Target Back in Focus
The breakout comes after several sessions of price compression, with HYPE continuing to trade within a broader technical structure...

Bitcoin whales send 49,000 BTC to exchanges as $60K rebound shows signs of weakness
Bitcoin’s recovery above $60,000 is facing a fresh test from exchange-flow and derivatives data after large holders moved one of t...

Bitcoin Price Prediction: Saylor’s Strategy is a Risk to Bitcoin, According to JP Morgan
JPMorgan has flagged a structural risk most Bitcoin price prediction bulls haven’t priced in: the same entity driving the most agg...

XRP vs Bitcoin: Investor Says RLUSD Growth and Regulatory Clarity Could Shift Crypto’s Balance of Power
While the claim remains highly ambitious given Bitcoin’s commanding lead in market capitalization, the discussion highlights broad...