Bitcoin Price Forms Double Bottom After Crash, Is A Bounce To $112,000 ATH Possible?
According to a TradingView crypto analyst named ‘TradingShot,’ the Bitcoin price has formed a Double Bottom pattern and is on track to reach a new All-Time High (ATH) of $112,000. This potential shift in trajectory comes...
Archive context
Older archive item. Useful for background and entity history, but not a fresh market-moving signal.

According to a TradingView crypto analyst named ‘TradingShot,’ the Bitcoin price has formed a Double Bottom pattern and is on track to reach a new All-Time High (ATH) of $112,000. This potential shift in trajectory comes after the cryptocurrency experienced a severe price crash that briefly pushed it below the $100,000 mark.
Bitcoin Price Finds Strong Support At Double BottomThe Bitcoin price crashed below $100,000 earlier this week as the China-based Artificial Intelligence (AI) model DeepSeek gained significant popularity across the US and global investment market, overtaking OpenAI’s ChatGPT. While this decline came as a shock, triggering a massive sell-off, Bitcoin managed to recover over 50% of its losses in a short time.
Following this severe crash, TradingShot revealed that Bitcoin had rebounded at a Double support level, using two strong support lines to prevent further price slips. The analyst shared a detailed price chart that highlights several Double Bottoms, including one forming near the 4-hour 200-Moving Average (4H MA200).
A Double Bottom pattern is a chart formation that indicates a potential trend reversal from a downtrend to an uptrend. It is characterized by two consecutive lows around the same price level and creates a W-shaped movement.
Looking at the chart, the Bitcoin price is moving within an Ascending Channel, indicating a general uptrend. The 4H MA200 on the orange trend line is a strong Double Bottom support level, which Bitcoin recently tested for the first time in 12 days.
TradingShot also mentioned a “Pivot trend line” in which Bitcoin previously faced resistance, starting from its ATH on December 17, 2024. This trend line now acts as a support line for the cryptocurrency, as its price has reversed near it. Notably, Bitcoin almost touched the bottom of January’s Channel Up, indicating a potential key support zone. This is similar to a pattern in December, where the cryptocurrency bounced off the same support and hit a new ATH.
Key Resistance At 4H MA50 — Breakout Or Rejection?In TradingShot’s chart, the 4H MA50 is indicated on the blue line, acting as a dynamic resistance level for the cryptocurrency. Currently, Bitcoin is trading below this Moving Average, meaning a breakout above this level could trigger more upside.
The analyst predicts that if Bitcoin breaks above the 4H MA50, it could continue its bullish momentum toward a higher price level between $110,000 and $112,000. This massive surge would mark a new ATH for the pioneer cryptocurrency, as the highest price Bitcoin has ever reached is above $108,000.
Supporting this bullish scenario, the TradingView analyst highlights Bitcoin’s Relative Strength Index (RSI), which shows oversold areas marked in green circles on the chart. Whenever RSI drops below 30, Bitcoin tends to rebound, indicating a potential for a strong bounce.
Conversely, the analyst forecasted a bearish scenario for Bitcoin if it faces a rejection around the 4H MA50. He predicts that Bitcoin could revisit the Double Bottom at $98,000, a bearish level observed on both December 23 and January 13. An even deeper correction is expected for this cryptocurrency if it continues on a downtrend, with the analyst projecting a crash to $96,000.
Why this matters
This bitcoin story adds another data point to the current market tape and is useful when read alongside nearby source coverage.
Original source
Read on NewsBTCRelated market context

Perplexity AI Predicts Insane $40 Price Target for XRP: How Did It Get There?
Perplexity AI predicts something that few analysts or other AI models do. It has produced an insanely wild bullish prediction for...

Standard Chartered says Ethena’s ENA could crush Bitcoin and Ethereum returns by 2028
Standard Chartered expects Ethena’s ENA token to rise about sevenfold by 2028, provided the protocol can rebuild its shrinking syn...

Lighter Crypto LIT Drops Violently on Robinhood Plan
Lighter crypto is trading at $3.86, down 13% over 24 hours and 26% over seven days. The selloff followed Robinhood’s decision to r...

XRP Price Prediction: Binance XRP Scarcity Index Hits 20-Month Low
XRP is trading at $1.50, down more than 1% over 24 hours, as Binance’s scarcity index signals a sharp reversal in exchange supply...

Ethereum Price Prediction: Could Aztec’s zk.money Drive ETH Higher as Zcash Fuels Privacy Narrative?
Ethereum is trading at $2,665, flat over 24 hours, leaving it below the $2,700–$2,735 resistance band as our recent price predicti...
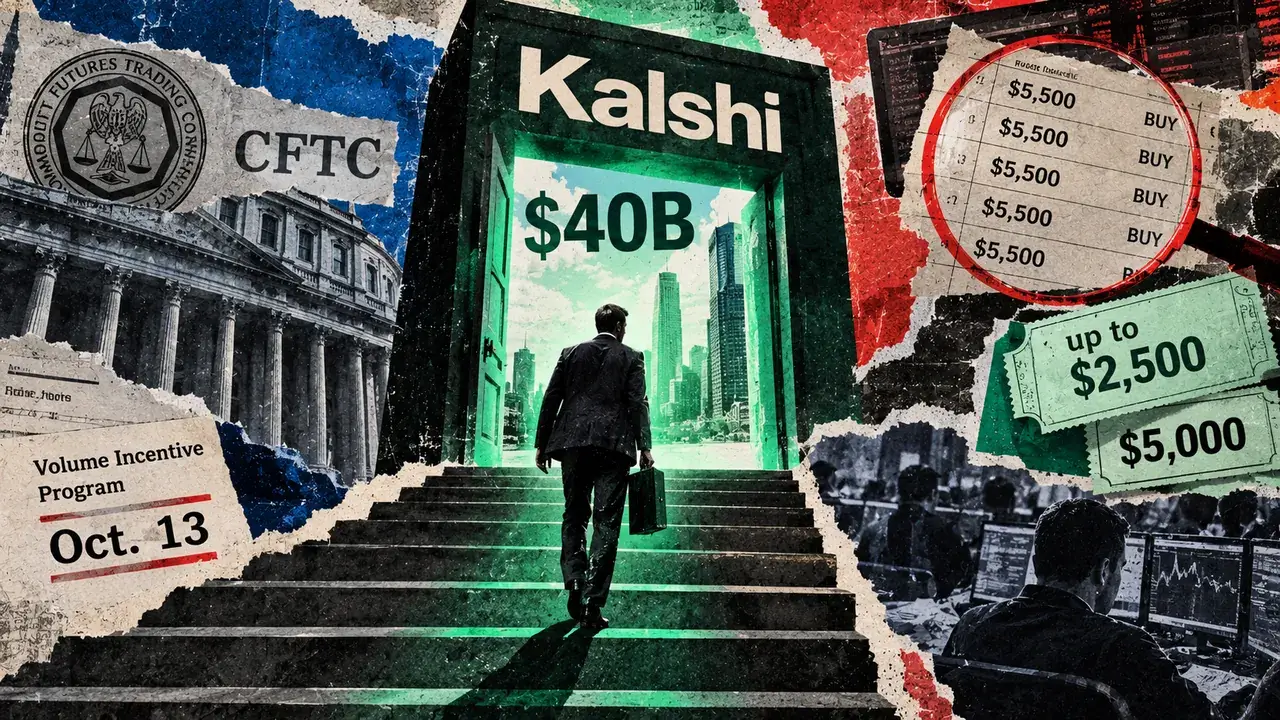
Kalshi’s $40 billion growth story hits tough questions about its trading volume
Kalshi is ending a trader-volume incentive program nearly a year early as scrutiny of activity in its crypto markets intensifies....