Bitcoin Price Gains Momentum: Bullish Surge Ahead?
Bitcoin price found support at $67,000 and started a fresh increase. BTC climbed above $69,500 and might continue to rise in the near term. Bitcoin started a decent increase above the $68,500 and $69,500 resistance level...
Archive context
Older archive item. Useful for background and entity history, but not a fresh market-moving signal.

Bitcoin price found support at $67,000 and started a fresh increase. BTC climbed above $69,500 and might continue to rise in the near term.
- Bitcoin started a decent increase above the $68,500 and $69,500 resistance levels.
- The price is trading above $68,500 and the 100 hourly Simple moving average.
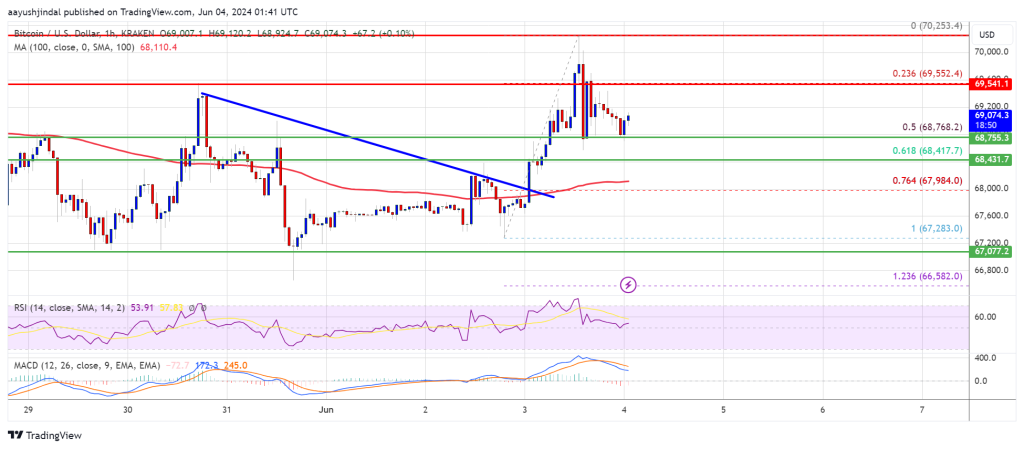
- There was a break above a key bearish trend line with resistance at $68,000 on the hourly chart of the BTC/USD pair (data feed from Kraken).
- The pair could gain bullish momentum if it settles above the $69,500 level.
Bitcoin price extended its decline below the $67,200 level. BTC retested the $66,650 zone and recently started a fresh increase. There was a clear move above the $68,500 resistance zone.
There was a break above a key bearish trend line with resistance at $68,000 on the hourly chart of the BTC/USD pair. The pair even cleared the $69,500 resistance zone and spiked above $70,000. A high was formed at $70,253 and the price is now correcting gains.
There was a move below the $69,500 level. The price dipped below the 23.6% Fib retracement level of the upward move from the $67,283 swing low to the $70,253 high.
Bitcoin is now trading above $68,500 and the 100 hourly Simple moving average. It is also holding gains above the 50% Fib retracement level of the upward move from the $67,283 swing low to the $70,253 high. On the upside, the price is facing resistance near the $69,200 level.
The first major resistance could be $69,550. The next key resistance could be $70,000. A clear move above the $70,200 resistance might send the price higher. In the stated case, the price could rise and test the $70,600 resistance. Any more gains might send BTC toward the $72,000 resistance.
Another Decline In BTC?If Bitcoin fails to climb above the $69,500 resistance zone, it could start another decline. Immediate support on the downside is near the $68,750 level.
The first major support is $68,400. The next support is now forming near $68,000. Any more losses might send the price toward the $67,200 support zone in the near term.
Technical indicators:
Hourly MACD – The MACD is now gaining pace in the bullish zone.
Hourly RSI (Relative Strength Index) – The RSI for BTC/USD is now above the 50 level.
Major Support Levels – $68,400, followed by $68,000.
Major Resistance Levels – $69,500, and $70,000.
Why this matters
This bitcoin story adds another data point to the current market tape and is useful when read alongside nearby source coverage.
Original source
Read on NewsBTCRelated market context

XRP Price Prediction: XRP Faces Critical Resistance Near $1.17 Despite Ripple Securing Landmark EU License
While the company secured a full MiCA license that expands its operations across the European Economic Area, market indicators sug...

Ethereum is losing ownership of crypto payments as Base moves $565B in stablecoins
Stablecoin activity is becoming a contest over which blockchains move the most tokenized dollars. Visa Onchain Analytics showed th...

Bitcoin (BTC) Price Prediction: BTC Holds $63K Support—Can Rising Active Addresses Offset Bearish Technical Signals?
Although the BTC price has remained near a key support zone, recent chart signals and Strategy’s sale of a portion of its Bitcoin...

Elon Musk Grok AI Predicts Incredible XRP Price Target by End of 2026
Elon Musk Grok AI just published what might be the most partnership-heavy XRP price prediction in this entire series. The model pr...

Sui DeFi TVL Breaks $1 Billion As Move-Based Chains Fight For Liquidity
Sui has crossed the $1 billion total value locked mark on DeFiLlama, giving the Move-based network a clearer claim to serious DeFi...
Solana’s $8.7B RWA surge shows tokenized assets are finally starting to move
Solana’s real-world asset transfer volume more than doubled over the past month, giving the network a stronger signal that tokeniz...