Bitcoin Price Holds in Range: Can Bulls Launch a Recovery?
Bitcoin price started a consolidation phase near the $58,500 level. BTC must clear the $60,500 resistance to start a recovery wave in the near term. Bitcoin tested the $58,000 zone before there was a minor recovery. The...
Archive context
Older archive item. Useful for background and entity history, but not a fresh market-moving signal.

Bitcoin price started a consolidation phase near the $58,500 level. BTC must clear the $60,500 resistance to start a recovery wave in the near term.
- Bitcoin tested the $58,000 zone before there was a minor recovery.
- The price is trading below $62,000 and the 100 hourly Simple moving average.
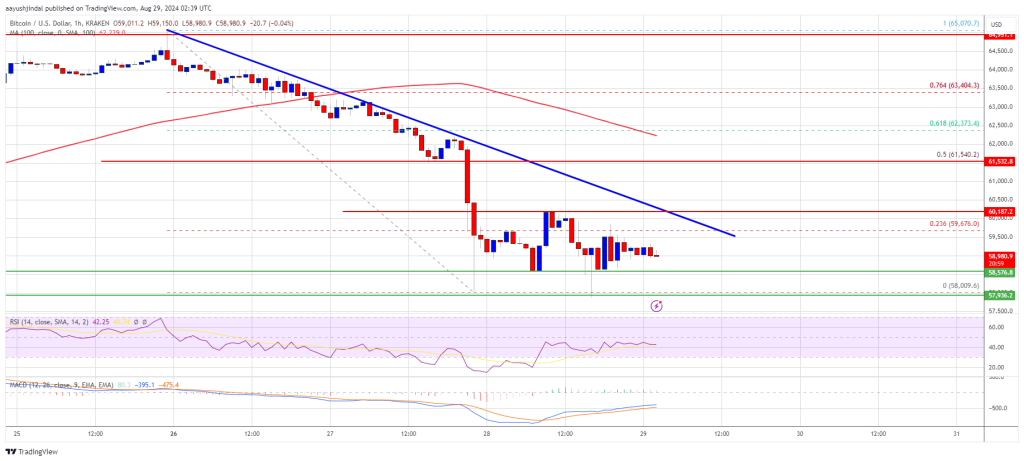
- There is a major bearish trend line forming with resistance at $60,200 on the hourly chart of the BTC/USD pair (data feed from Kraken).
- The pair might slip again if there is no move above the $60,500 resistance.
Bitcoin price gained bearish momentum below the $62,500 level. The price even dived below the $60,000 level. Finally, the bulls appeared near the $58,000 level.
A low was formed at $58,009 and the price is now consolidating losses. There was a minor recovery wave above the $58,500 and $58,800 levels. The price tested the 23.6% Fib retracement level of the downward wave from the $65,070 swing high to the $58,009 low.
Bitcoin is now trading below $61,200 and the 100 hourly Simple moving average. On the upside, the price could face resistance near the $59,650 level. The first key resistance is near the $60,000 level. There is also a major bearish trend line forming with resistance at $60,200 on the hourly chart of the BTC/USD pair.
A clear move above the $60,200 resistance might send the price further higher in the coming sessions. The next key resistance could be $61,500. It is close to the 50% Fib retracement level of the downward wave from the $65,070 swing high to the $58,009 low.
A close above the $61,500 resistance might spark more upsides. In the stated case, the price could rise and test the $62,500 resistance.
More Downsides In BTC?If Bitcoin fails to rise above the $60,200 resistance zone, it could continue to move down. Immediate support on the downside is near the $58,550 level.
The first major support is $58,000. The next support is now near the $57,650 zone. Any more losses might send the price toward the $56,500 support in the near term.
Technical indicators:
Hourly MACD – The MACD is now losing pace in the bearish zone.
Hourly RSI (Relative Strength Index) – The RSI for BTC/USD is now below the 50 level.
Major Support Levels – $58,550, followed by $58,000.
Major Resistance Levels – $60,200, and $61,500.
Why this matters
This bitcoin story adds another data point to the current market tape and is useful when read alongside nearby source coverage.
Original source
Read on NewsBTCRelated market context

Ethereum (ETH) Price Prediction: ETH Holds Near $1,780 as Bulls Eye $1,860–$1,950, but $1,609 Remains Key Invalidation
Ethereum price is trading near $1,779 after a mixed 24-hour session, according to Brave New Coin data. ETH is down around 0.76% on...

Solana Price Prediction: SOL Holds Near $81 as Breakout Setup Points to $87, but Whale Flows Keep Risk Active
Solana price is back in focus after a sharp recovery pushed SOL towards the $81 area. The move has improved short-term momentum, e...

XRP Price Prediction: Volume and ETF Inflow Send Ripple Token Higher
XRP price pushed above the $1.14 resistance area after buyers stepped in with heavy volume and bullish prediction. The token climb...

Ethereum Price Prediction: Vitalik Hints at 3-4 Years Long ETH Rebuild
Ethereum price is trading at $1,780 as Vitalik Buterin revealed the network’s biggest roadmap since the Merge, which somehow sends...

Hyperliquid (HYPE) Price Prediction: Symmetrical Triangle Breakout Puts $77 Target Back in Focus
The breakout comes after several sessions of price compression, with HYPE continuing to trade within a broader technical structure...

Ethereum returns to top 100 global assets as market cap climbs back above $215 billion
Ethereum's market cap recovery enhances its appeal to institutional investors, potentially boosting its role in decentralized fina...