Bitcoin Price Is Showing Early Signs of Recovery But 100 SMA Is The Key
Bitcoin price found support near the $60,600 zone. BTC is recovering but the bears might remain active near the $63,200 resistance zone. Bitcoin tested the $60,60 support zone and started a recovery wave. The price is tr...
Archive context
Older archive item. Useful for background and entity history, but not a fresh market-moving signal.

Bitcoin price found support near the $60,600 zone. BTC is recovering but the bears might remain active near the $63,200 resistance zone.
- Bitcoin tested the $60,60 support zone and started a recovery wave.
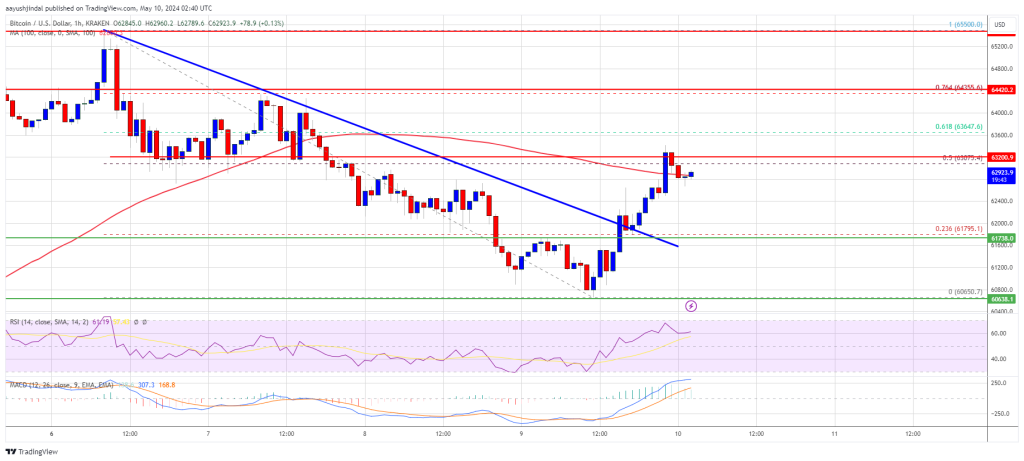
- The price is trading near $63,000 and the 100 hourly Simple moving average.
- There was a break above a key bearish trend line with resistance at $62,000 on the hourly chart of the BTC/USD pair (data feed from Kraken).
- The pair could gain bullish momentum if there is a close above $63,200 and the 100 hourly Simple moving average.
Bitcoin price extended losses below the $62,000 and $61,200 levels. Finally, the bulls appeared near the $60,600 zone. A low was formed at $60,650 and the price is now correcting losses.
There was a move above the $61,200 and $62,000 resistance levels. The price cleared the 23.6% Fib retracement level of the recent drop from the $65,500 swing high to the $60,650 low. Besides, there was a break above a key bearish trend line with resistance at $62,000 on the hourly chart of the BTC/USD pair.
Bitcoin is now trading near $63,000 and the 100 hourly Simple moving average. Immediate resistance is near the $63,000 level. The first major resistance could be $63,200 or the 50% Fib retracement level of the recent drop from the $65,500 swing high to the $60,650 low or the 100 hourly Simple moving average.
Source: BTCUSD on TradingView.com
The next key resistance could be $64,350. A clear move above the $64,350 resistance might send the price higher. The main resistance now sits at $65,500. If there is a close above the $65,500 resistance zone, the price could continue to move up. In the stated case, the price could rise toward $67,500.
More Downsides In BTC?If Bitcoin fails to climb above the $63,200 resistance zone, it could start another decline. Immediate support on the downside is near the $62,400 level.
The first major support is $62,000. If there is a close below $62,000, the price could start to drop toward $61,200. Any more losses might send the price toward the $60,600 support zone in the near term.
Technical indicators:
Hourly MACD – The MACD is now gaining pace in the bullish zone.
Hourly RSI (Relative Strength Index) – The RSI for BTC/USD is now above the 50 level.
Major Support Levels – $62,000, followed by $60,600.
Major Resistance Levels – $63,000, $63,200, and $64,350.
Why this matters
This bitcoin story adds another data point to the current market tape and is useful when read alongside nearby source coverage.
Original source
Read on NewsBTCRelated market context

XRP Price Prediction: XRP Faces Critical Resistance Near $1.17 Despite Ripple Securing Landmark EU License
While the company secured a full MiCA license that expands its operations across the European Economic Area, market indicators sug...

Bitcoin (BTC) Price Prediction: BTC Holds $63K Support—Can Rising Active Addresses Offset Bearish Technical Signals?
Although the BTC price has remained near a key support zone, recent chart signals and Strategy’s sale of a portion of its Bitcoin...

Bitcoin price rebounds to $63K as leverage returns creating short term volatility risk
Bitcoin's rebound has cleared the first test: price recovered. The harder one starts now: proving buyers remain after the squeeze....

Elon Musk Grok AI Predicts Incredible XRP Price Target by End of 2026
Elon Musk Grok AI just published what might be the most partnership-heavy XRP price prediction in this entire series. The model pr...

IPO volume hits levels last seen in 1929 and 2000, and crypto markets are building the on-ramp
The surge in IPOs and crypto's role in facilitating access could signal heightened market volatility and regulatory challenges ahe...

Sam Altman ChatGPT AI Predicts Insane Bitcoin Price by 2026
Sam Altman ChatGPT AI just circled November on the calendar and put a number next to Bitcoin Price Prediction. The model predicts...