Bitcoin Price Powers Over $90K as Buyers Suddenly Regain Control of the Trend
Bitcoin price started a recovery wave above $90,000. BTC is now consolidating and might soon aim for a move above the $91,500 zone. Bitcoin started a recovery wave and climbed toward $92,000. The price is trading above $...
Archive context
Older archive item. Useful for background and entity history, but not a fresh market-moving signal.

Bitcoin price started a recovery wave above $90,000. BTC is now consolidating and might soon aim for a move above the $91,500 zone.
- Bitcoin started a recovery wave and climbed toward $92,000.
- The price is trading above $90,000 and the 100 hourly Simple moving average.
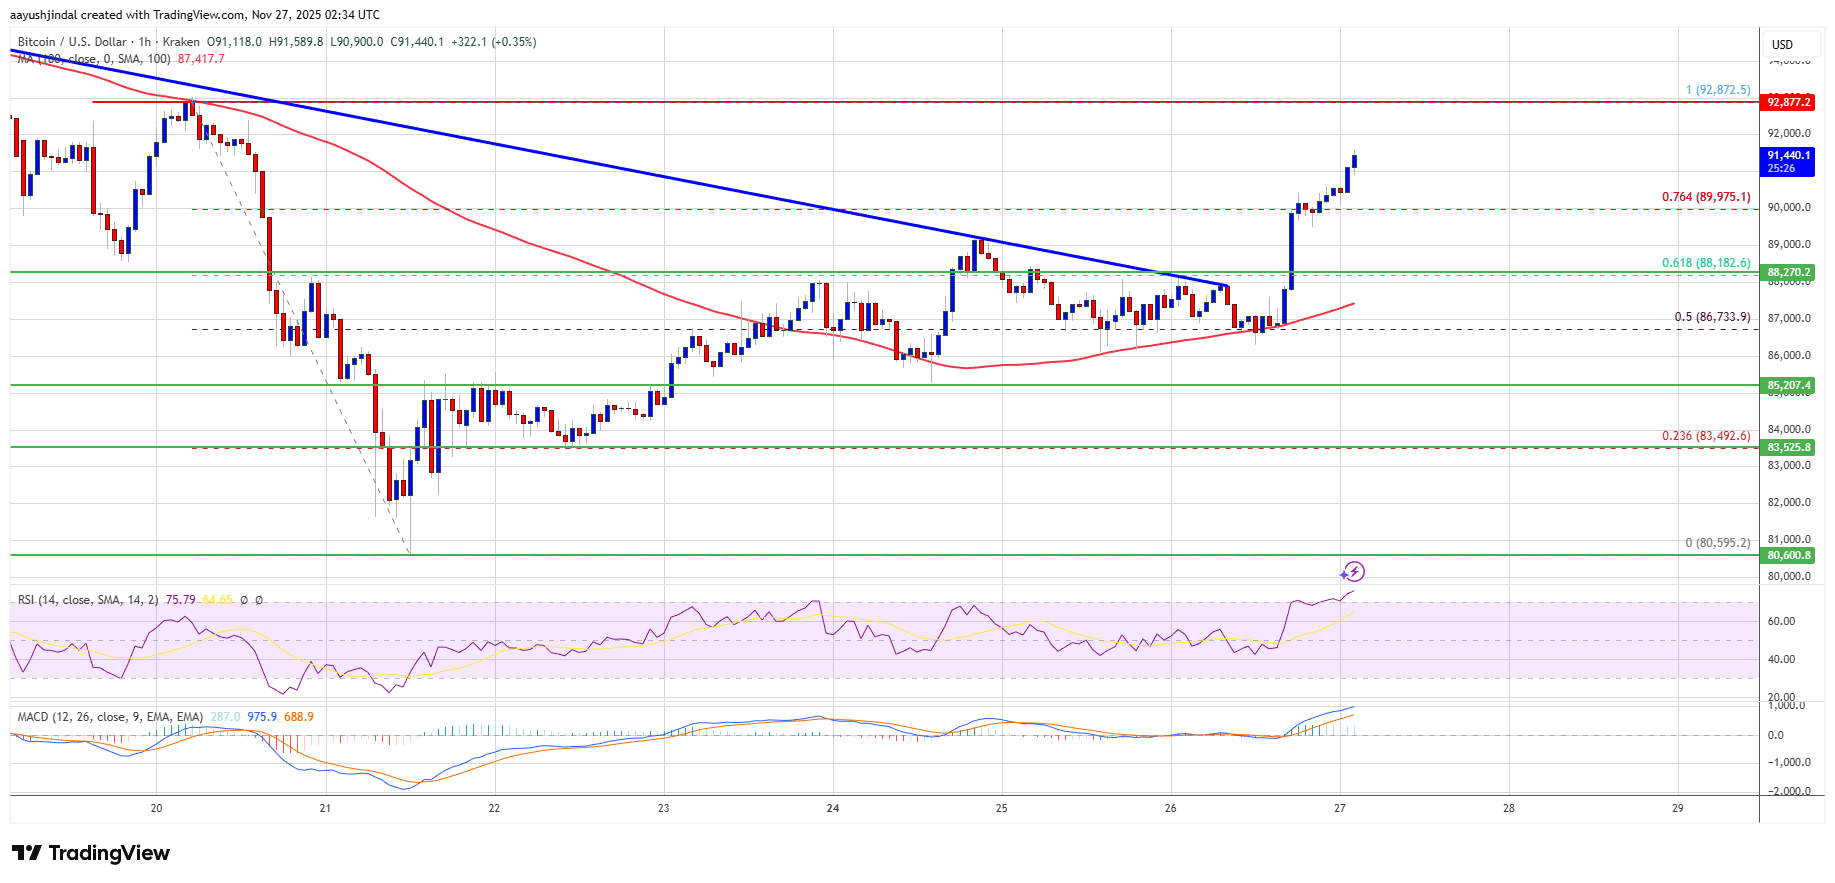
- There was a break above a key bearish trend line with resistance at $88,000 on the hourly chart of the BTC/USD pair (data feed from Kraken).
- The pair might continue to move up if it settles above the $91,500 zone.
Bitcoin price managed to stay above the $86,500 level. BTC formed a base and recently started a recovery wave above the $88,000 resistance zone.
There was a break above a key bearish trend line with resistance at $88,000 on the hourly chart of the BTC/USD pair. The pair surged above the $90,000 level. There was a clear break above the 61.8% Fib retracement level of the downward move from the $92,872 swing high to the $80,595 low.
Bitcoin is now trading above $90,500 and the 100 hourly Simple moving average. It is also above the 76.4% Fib retracement level of the downward move from the $92,872 swing high to the $80,595 low.
If the bulls remain in action, the price could face resistance near the $91,500 level. The first key resistance is near the $92,000 level. The next resistance could be $92,500. A close above the $92,500 resistance might send the price further higher. In the stated case, the price could rise and test the $93,750 resistance. Any more gains might send the price toward the $94,500 level. The next barrier for the bulls could be $95,000 and $95,500.
Another Decline In BTC?If Bitcoin fails to rise above the $92,000 resistance zone, it could start another decline. Immediate support is near the $89,750 level. The first major support is near the $88,500 level.
The next support is now near the $88,000 zone. Any more losses might send the price toward the $86,500 support in the near term. The main support sits at $85,000, below which BTC might accelerate lower in the near term.
Technical indicators:
Hourly MACD – The MACD is now gaining pace in the bullish zone.
Hourly RSI (Relative Strength Index) – The RSI for BTC/USD is now above the 50 level.
Major Support Levels – $89,750, followed by $88,000.
Major Resistance Levels – $92,000 and $92,500.
Why this matters
This bitcoin story adds another data point to the current market tape and is useful when read alongside nearby source coverage.
Original source
Read on NewsBTCRelated market context

Solana Price Prediction: SOL Holds Near $81 as Breakout Setup Points to $87, but Whale Flows Keep Risk Active
Solana price is back in focus after a sharp recovery pushed SOL towards the $81 area. The move has improved short-term momentum, e...

XRP Price Prediction: SuperTrend Buy Signal Meets Shrinking Supply as $1.24 Breakout Comes Into Focus
After a fresh SuperTrend buy signal appeared on the 4-hour chart, analysts are watching whether the XRP price can extend its recen...

Bitcoin whales send 49,000 BTC to exchanges as $60K rebound shows signs of weakness
Bitcoin’s recovery above $60,000 is facing a fresh test from exchange-flow and derivatives data after large holders moved one of t...

Hyperliquid (HYPE) Price Prediction: Symmetrical Triangle Breakout Puts $77 Target Back in Focus
The breakout comes after several sessions of price compression, with HYPE continuing to trade within a broader technical structure...

Bitcoin Rebounds Toward $63,000, But ETF Flows Still Hold The Key
Bitcoin has started the new week with a little more colour on the screen. After sliding through the kind of levels that usually tr...

XRP vs Bitcoin: Investor Says RLUSD Growth and Regulatory Clarity Could Shift Crypto’s Balance of Power
While the claim remains highly ambitious given Bitcoin’s commanding lead in market capitalization, the discussion highlights broad...