Bitcoin Price Pullback Tests Bulls — Bounce Attempt Incoming?
Bitcoin price started a recovery wave above the $68,500 zone. BTC is now consolidating and might aim for more gains above $70,500. Bitcoin started a decent recovery wave above the $69,200 zone. The price is trading above...

Bitcoin price started a recovery wave above the $68,500 zone. BTC is now consolidating and might aim for more gains above $70,500.
- Bitcoin started a decent recovery wave above the $69,200 zone.
- The price is trading above $68,500 and the 100 hourly simple moving average.
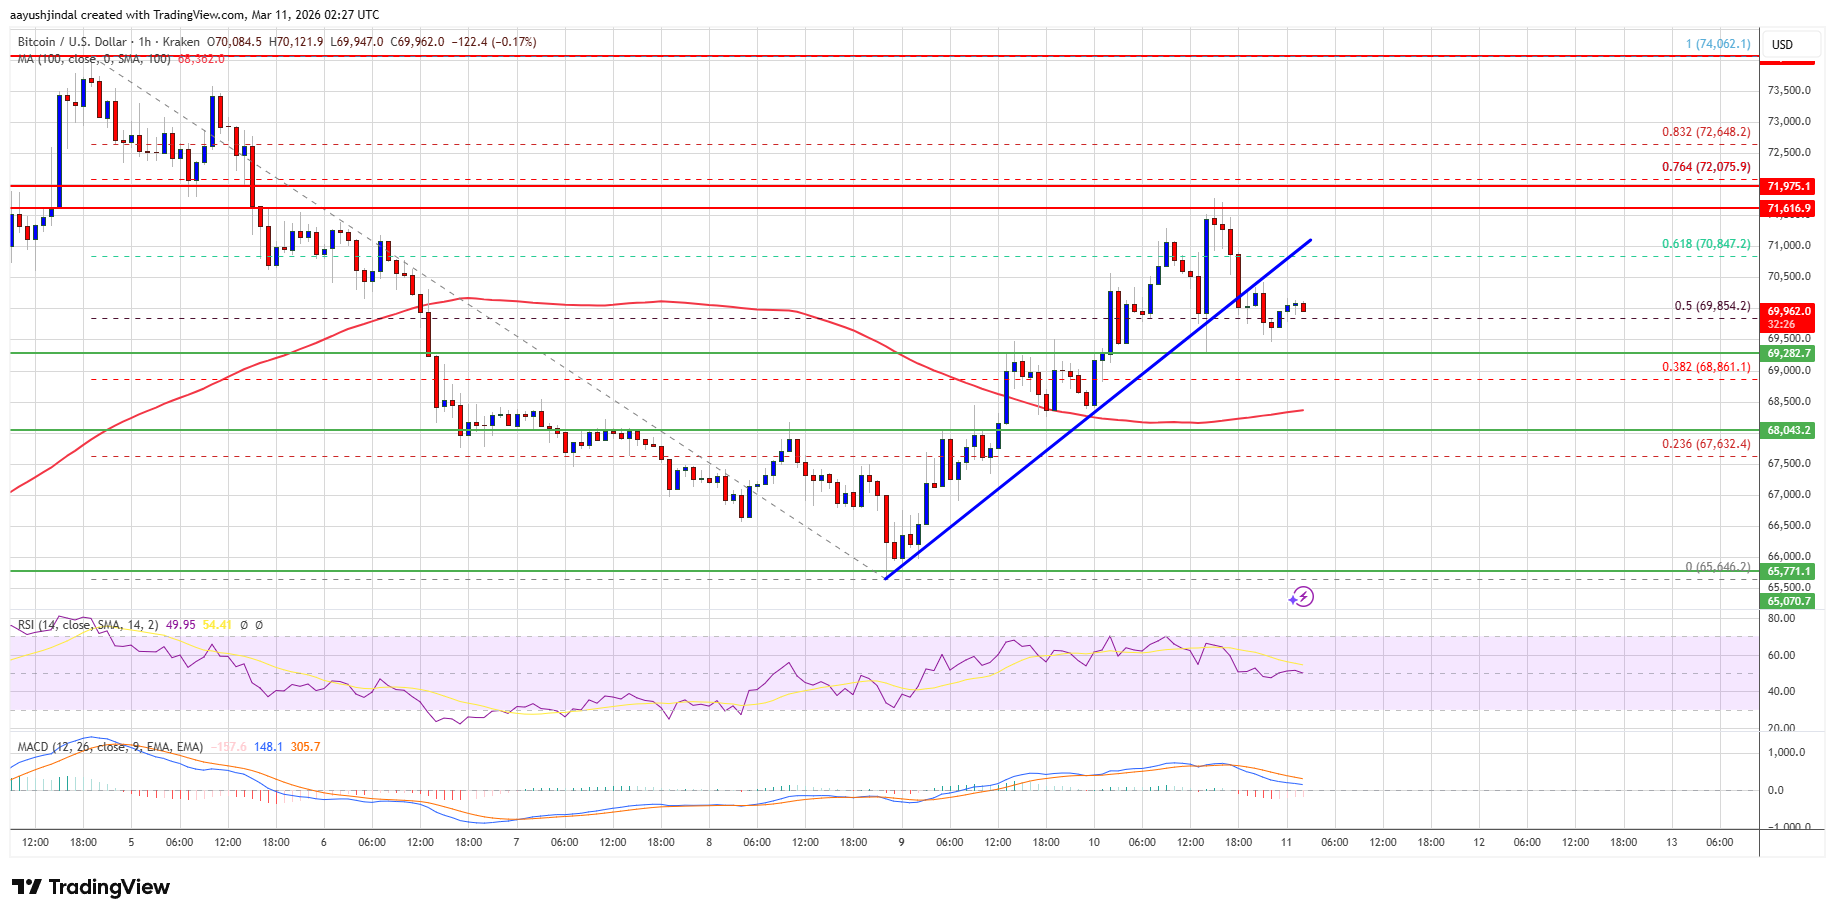
- There was a break below a bullish trend line with support at $70,400 on the hourly chart of the BTC/USD pair (data feed from Kraken).
- The pair might dip again if it trades below the $69,280 and $68,000 levels.
Bitcoin price remained elevated and extended its increase above the $68,500 level. BTC climbed above the $69,200 and $70,000 resistance levels.
The bulls pushed the price above the 61.8% Fib retracement level of the downward move from the $74,062 swing high to the $65,646 low. However, the bears are still active below $72,000. The price faced rejection near the $71,600 level and started a downside correction.
There was a break below a bullish trend line with support at $70,400 on the hourly chart of the BTC/USD pair. Bitcoin is now trading above $68,500 and the 100 hourly simple moving average. If the price remains stable above $68,500, it could attempt a fresh increase. Immediate resistance is near the $70,250 level.
The first key resistance is near the $70,500 level. A close above the $70,500 resistance might send the price further higher. In the stated case, the price could rise and test the $71,500 resistance. Any more gains might send the price toward the $72,000 level or the 76.4% Fib retracement level of the downward move from the $74,062 swing high to the $65,646 low. The next barrier for the bulls could be $72,650.
More Losses In BTC?If Bitcoin fails to rise above the $70,500 resistance zone, it could start another decline. Immediate support is near the $69,280 level. The first major support is near the $68,500 level.
The next support is now near the $68,000 zone. Any more losses might send the price toward the $67,250 support in the near term. The main support now sits at $66,500, below which BTC might struggle to recover in the near term.
Technical indicators:
Hourly MACD – The MACD is now gaining pace in the bearish zone.
Hourly RSI (Relative Strength Index) – The RSI for BTC/USD is now near the 50 level.
Major Support Levels – $68,500, followed by $68,000.
Major Resistance Levels – $70,500 and $72,000.
Original source
Read on NewsBTCRelated market context

Bitcoin (BTC) Price Prediction: BTC Eyes $70K Liquidity Sweep as Whales Reclaim Control Near $62K
Market data suggests that long-term holders remain largely inactive, while whale activity is beginning to recover, creating an int...

Bitcoin’s $60,000 support is still a bet on the dollar breaking
Glassnode's latest Week On-chain report says Bitcoin has entered a deep discount phase, with over 95% of short-term holders underw...

Kraken Becomes Official Crypto Exchange Supporter Of FIFA World Cup 2026
TL;DR Kraken says it has become the Official Crypto Exchange Supporter of the FIFA World Cup 2026. The tournament expands to 48 te...

XRP Price Prediction: Japan XRP ETF Listing is Getting Closer
Japan just handed XRP bulls a major regulatory tailwind. XRP price is retesting a congestion zone, and the prediction could turn b...

The 3-Part Impulse That Shows Where The XRP Price Is Headed Next
XRP bulls are trying to turn a brutal selloff into something bigger than a relief bounce. An interesting setup shows a possible th...

Most Traders Will Scroll Past This Grok AI Bitcoin Predicts, Big Mistake
Elon Musk Grok AI just looked at a Bitcoin chart down more than 50% and predicts it’s a classic accumulation zone, targeting $150,...