Bitcoin Price Pulls Back to Support: Opportunity or Warning Sign?
Bitcoin price started a fresh surge above the $102,500 zone. BTC is now correcting gains and trading below the $103,500 resistance zone. Bitcoin started a strong increase above the $102,500 resistance zone. The price is...
Archive context
Older archive item. Useful for background and entity history, but not a fresh market-moving signal.

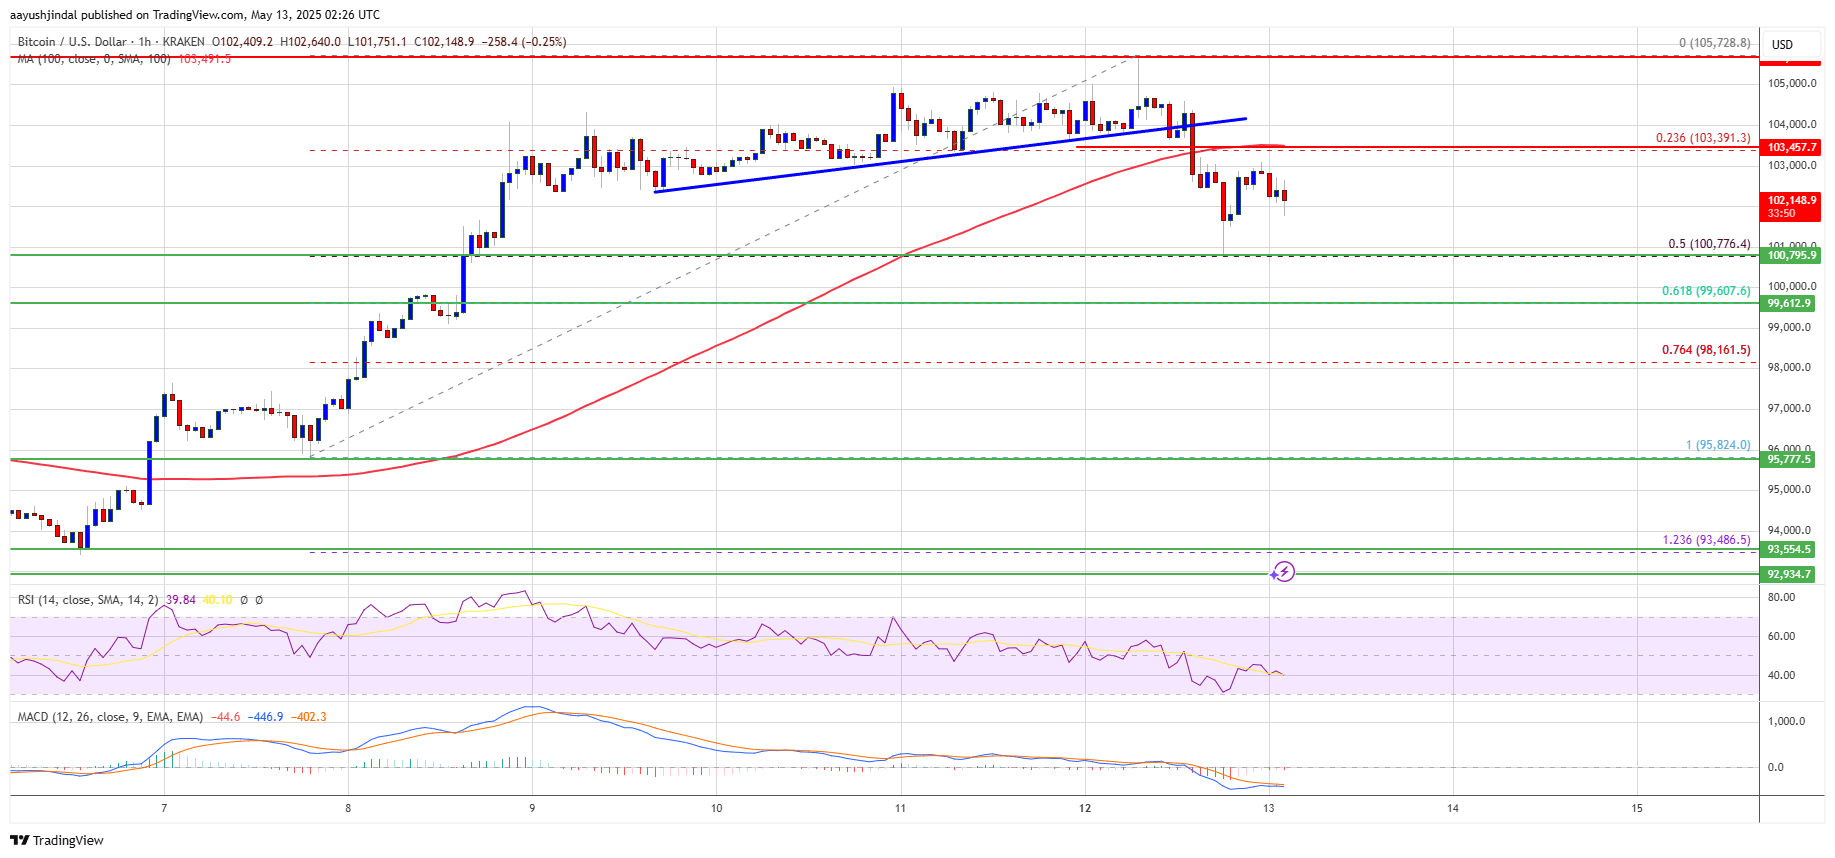
Bitcoin price started a fresh surge above the $102,500 zone. BTC is now correcting gains and trading below the $103,500 resistance zone.
- Bitcoin started a strong increase above the $102,500 resistance zone.
- The price is trading below $104,000 and the 100 hourly Simple moving average.
- There was a break below a new connecting bullish trend line with support at $103,900 on the hourly chart of the BTC/USD pair (data feed from Kraken).
- The pair could start another increase if it clears the $103,500 zone.
Bitcoin price started a fresh increase from the $98,500 support zone. BTC formed a base and was able to clear the $100,000 resistance zone. The bulls even pushed the price above $103,000.
The pair spiked above $105,500 and tested $105,800. A high is formed at $105,728 and the price is now correcting gains. There was a move below the 23.6% Fib retracement level of the upward move from the $95,825 swing low to the $105,728 high.
There was break below a new connecting bullish trend line with support at $103,900 on the hourly chart of the BTC/USD pair. Bitcoin is now trading below $104,500 and the 100 hourly Simple moving average.
However, the bulls are now active near the $100,800 support and protecting the 50% Fib retracement level of the upward move from the $95,825 swing low to the $105,728 high. On the upside, immediate resistance is near the $103,500 level. The first key resistance is near the $104,000 level.
The next key resistance could be $105,000. A close above the $105,000 resistance might send the price further higher. In the stated case, the price could rise and test the $106,000 resistance level. Any more gains might send the price toward the $108,000 level.
More Losses In BTC?If Bitcoin fails to rise above the $103,500 resistance zone, it could start another downside correction. Immediate support on the downside is near the $101,500 level. The first major support is near the $100,800 level.
The next support is now near the $100,000 zone. Any more losses might send the price toward the $98,800 support in the near term. The main support sits at $97,500.
Technical indicators:
Hourly MACD – The MACD is now losing pace in the bullish zone.
Hourly RSI (Relative Strength Index) – The RSI for BTC/USD is now below the 50 level.
Major Support Levels – $101,500, followed by $100,800.
Major Resistance Levels – $103,500 and $105,000.
Why this matters
This bitcoin story adds another data point to the current market tape and is useful when read alongside nearby source coverage.
Original source
Read on NewsBTCRelated market context

XRP vs Bitcoin: Investor Says RLUSD Growth and Regulatory Clarity Could Shift Crypto’s Balance of Power
While the claim remains highly ambitious given Bitcoin’s commanding lead in market capitalization, the discussion highlights broad...

XRP Price Prediction: SuperTrend Buy Signal Meets Shrinking Supply as $1.24 Breakout Comes Into Focus
After a fresh SuperTrend buy signal appeared on the 4-hour chart, analysts are watching whether the XRP price can extend its recen...

Bitcoin whales send 49,000 BTC to exchanges as $60K rebound shows signs of weakness
Bitcoin’s recovery above $60,000 is facing a fresh test from exchange-flow and derivatives data after large holders moved one of t...

Leading Claude AI Fable 5 Predicts Stunning XRP Price by The End of 2026
Anthropic’s new Claude AI model, Fable 5, predicts XRP price for the entire second half around a single event that could be resolv...

JP Morgan Warns of New Bitcoin Sell Pressure From Strategy While XRP AI Transactions Approach 1 Million
Although the two developments are unrelated, they illustrate how Bitcoin’s institutional investment narrative and XRP’s expanding...

Bitcoin Price Prediction: Saylor’s Strategy is a Risk to Bitcoin, According to JP Morgan
JPMorgan has flagged a structural risk most Bitcoin price prediction bulls haven’t priced in: the same entity driving the most agg...