Bitcoin Price Rally Slows, Consolidation Signals Possible Next Move
Bitcoin price started a steady increase above $70,500 and $72,500. BTC is now consolidating and might aim for a fresh increase above $72,500. Bitcoin started a fresh increase after it settled above the $70,000 zone. The...

Bitcoin price started a steady increase above $70,500 and $72,500. BTC is now consolidating and might aim for a fresh increase above $72,500.
- Bitcoin started a fresh increase after it settled above the $70,000 zone.
- The price is trading above $70,000 and the 100 hourly simple moving average.
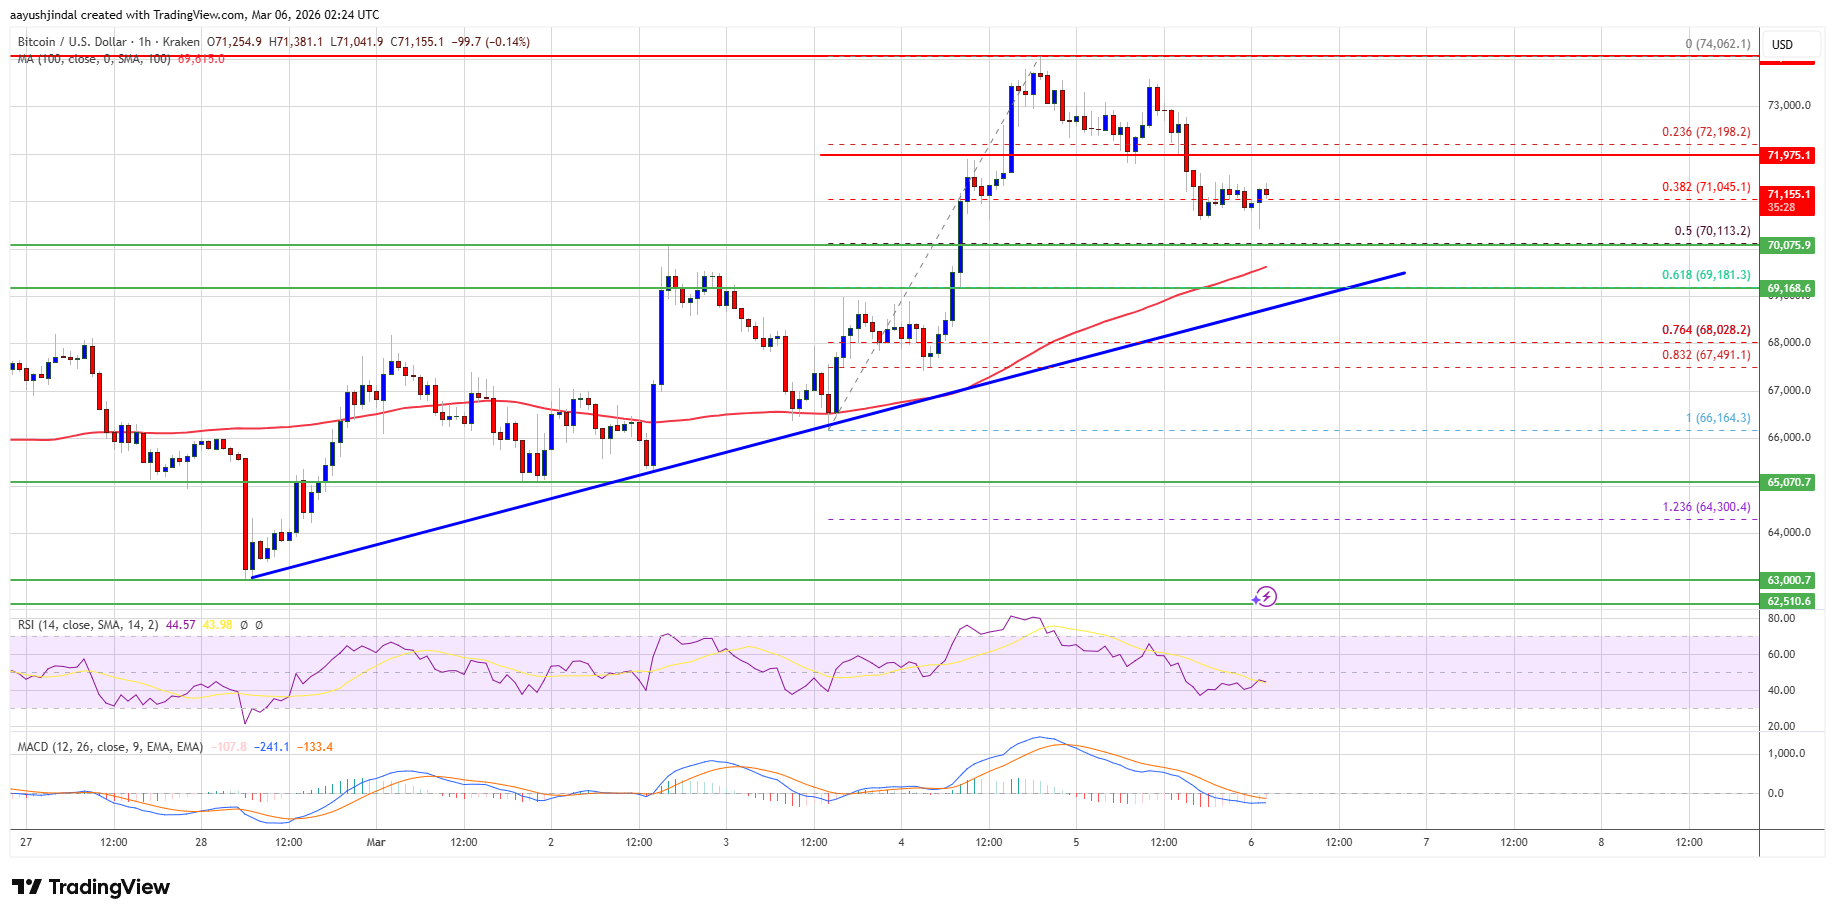
- There is a bullish trend line forming with support at $69,000 on the hourly chart of the BTC/USD pair (data feed from Kraken).
- The pair might dip again if it trades below the $70,000 and $69,000 levels.
Bitcoin price extended its increase above the $68,500 zone. BTC gained pace for a move above the $70,000 resistance zone. The price even rallied above the $72,000 resistance.
Finally, the bears appeared near $74,000. A high was formed at $74,062, and the price recently started a downside correction. There was a move below $72,000 and the 23.6% Fib retracement level of the upward move from the $66,164 swing low to the $74,062 high.
Bitcoin is now trading above $70,000 and the 100 hourly simple moving average. There is also a bullish trend line forming with support at $69,000 on the hourly chart of the BTC/USD pair.
If the price remains stable above $70,000, it could attempt a fresh increase. Immediate resistance is near the $72,000 level. The first key resistance is near the $72,500 level. A close above the $72,500 resistance might send the price further higher. In the stated case, the price could rise and test the $73,200 resistance. Any more gains might send the price toward the $74,000 level. The next barrier for the bulls could be $75,000 and $75,500.
Downside Correction In BTC?If Bitcoin fails to rise above the $72,000 resistance zone, it could start another decline. Immediate support is near the $70,000 level or the 50% Fib retracement level of the upward move from the $66,164 swing low to the $74,062 high. The first major support is near the $69,000 level.
The next support is now near the $68,500 zone. Any more losses might send the price toward the $68,000 support in the near term. The main support now sits at $66,200, below which BTC might struggle to recover in the near term.
Technical indicators:
Hourly MACD – The MACD is now losing pace in the bullish zone.
Hourly RSI (Relative Strength Index) – The RSI for BTC/USD is now below the 50 level.
Major Support Levels – $70,000, followed by $69,000.
Major Resistance Levels – $72,000 and $72,500.
Original source
Read on NewsBTCRelated market context

The 3-Part Impulse That Shows Where The XRP Price Is Headed Next
XRP bulls are trying to turn a brutal selloff into something bigger than a relief bounce. An interesting setup shows a possible th...

Kraken Adds USDCx Support On Canton As Institutional Stablecoin Rails Expand
TL;DR Kraken says it now supports USDCx deposits and withdrawals on the Canton Network. USDCx is described as a Canton-native stab...

Ripple chases AI’s machine economy as XRPL stablecoins near $1 billion
Stablecoin liquidity on the XRP Ledger (XRPL) has nearly doubled over the past month, putting the network within reach of a $1 bil...

Kraken Becomes Official Crypto Exchange Supporter Of FIFA World Cup 2026
TL;DR Kraken says it has become the Official Crypto Exchange Supporter of the FIFA World Cup 2026. The tournament expands to 48 te...

Bitcoin Price Prediction: JPMorgan Fuds BTC as Debasement Trade Retreat Accelerates
JPMorgan is calling it. The debasement trade, or the macro thesis that drove billions into Bitcoin price and gold, is unwinding, a...

Most Traders Will Scroll Past This Grok AI Bitcoin Predicts, Big Mistake
Elon Musk Grok AI just looked at a Bitcoin chart down more than 50% and predicts it’s a classic accumulation zone, targeting $150,...