Bitcoin Price Rangebound After Surge — Breakout Momentum Building?
Bitcoin price started a strong increase and traded above the $75,500 zone. BTC is now consolidating and might aim for more gains if it clears $76,000. Bitcoin started a decent upward move above the $75,000 zone. The pric...

Bitcoin price started a strong increase and traded above the $75,500 zone. BTC is now consolidating and might aim for more gains if it clears $76,000.
- Bitcoin started a decent upward move above the $75,000 zone.
- The price is trading above $73,500 and the 100 hourly simple moving average.
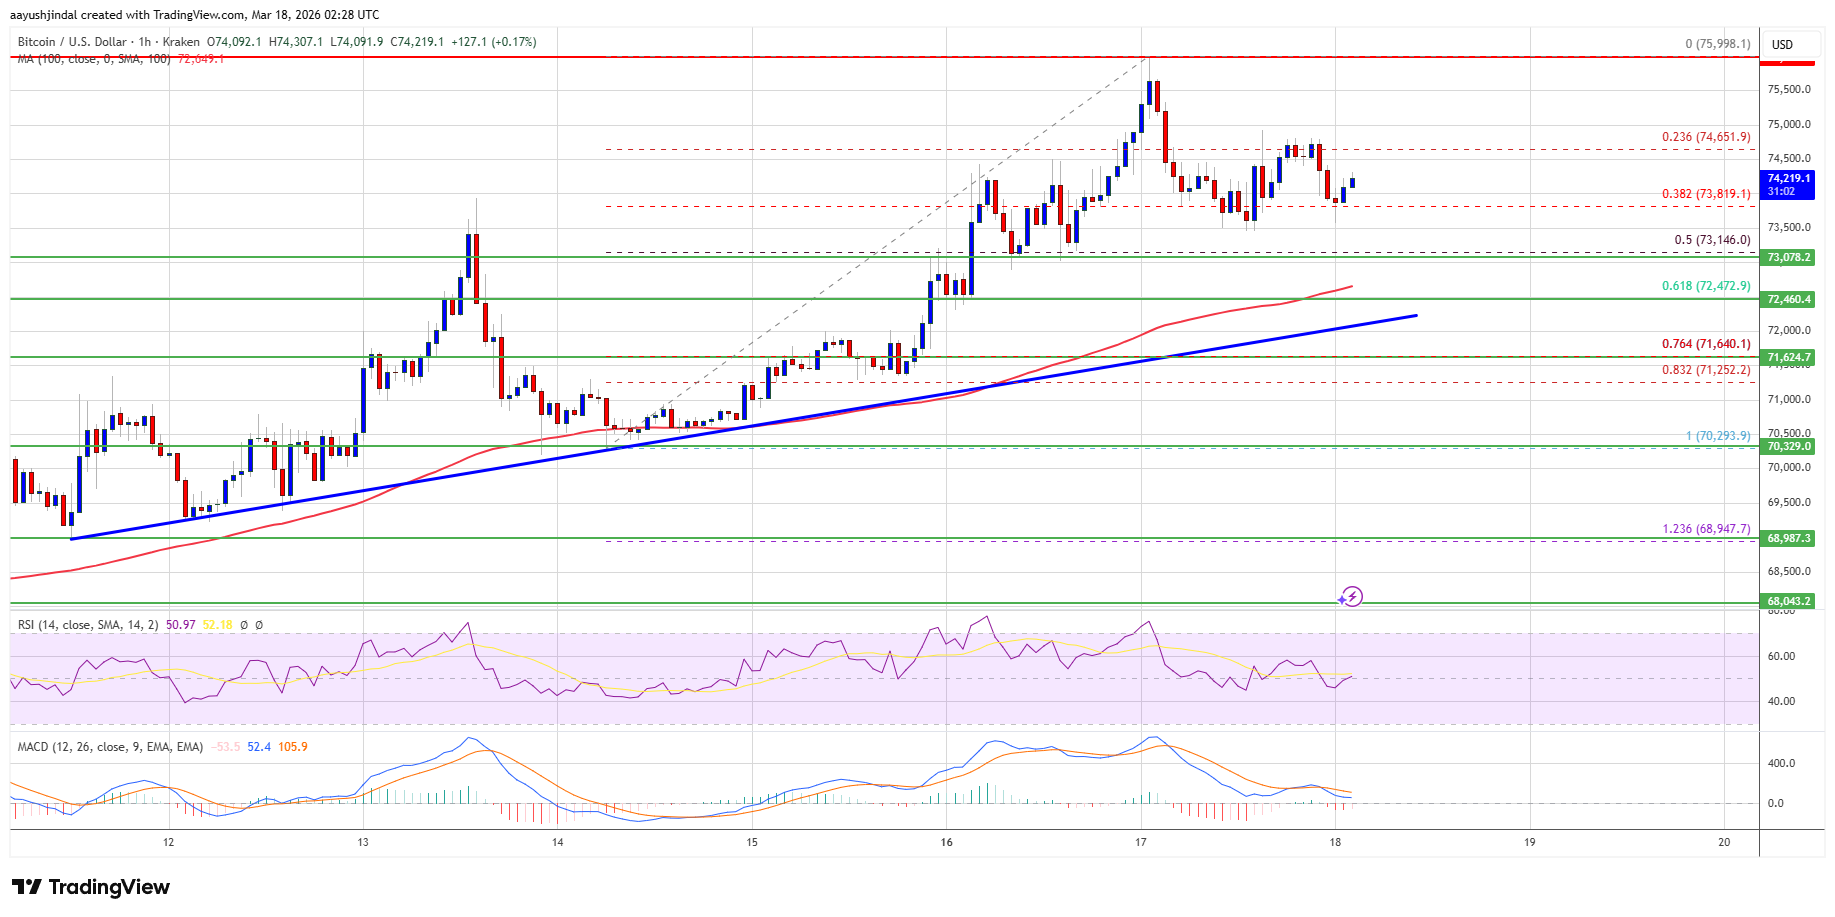
- There is a bullish trend line forming with support at $72,000 on the hourly chart of the BTC/USD pair (data feed from Kraken).
- The pair might continue to rise if it clears the $75,000 and $76,000 levels.
Bitcoin price remained supported and extended its increase above the $73,500 level. BTC climbed above the $74,200 and $74,500 resistance levels.
The bulls were able to pump the price above $75,000. A high was formed at $75,998, and the price recently corrected some gains. There was a move below the 23.6% Fib retracement level of the recent upward move from the $70,292 swing low to the $75,998 high.
Bitcoin is now trading above $73,500 and the 100 hourly simple moving average. Besides, there is a bullish trend line forming with support at $72,000 on the hourly chart of the BTC/USD pair.
If the price remains stable above $72,000, it could attempt a fresh increase. Immediate resistance is near the $75,000 level. The first key resistance is near the $75,500 level. A close above the $75,500 resistance might send the price further higher. In the stated case, the price could rise and test the $76,200 resistance. Any more gains might send the price toward the $77,500 level. The next barrier for the bulls could be $78,000.
Downside Extension In BTC?If Bitcoin fails to rise above the $75,000 resistance zone, it could start another decline. Immediate support is near the $73,800 level. The first major support is near the $73,150 level or the 50% Fib retracement level of the recent upward move from the $70,292 swing low to the $75,998 high.
The next support is now near the $72,000 zone and the trend line. Any more losses might send the price toward the $71,650 support in the near term. The main support now sits at $71,200, below which BTC might struggle to recover in the near term.
Technical indicators:
Hourly MACD – The MACD is now losing pace in the bullish zone.
Hourly RSI (Relative Strength Index) – The RSI for BTC/USD is now above the 50 level.
Major Support Levels – $73,800, followed by $73,150.
Major Resistance Levels – $75,000 and $76,200.
Original source
Read on NewsBTCRelated market context

Kraken Adds USDCx Support On Canton As Institutional Stablecoin Rails Expand
TL;DR Kraken says it now supports USDCx deposits and withdrawals on the Canton Network. USDCx is described as a Canton-native stab...

XRP Price Prediction: Japan XRP ETF Listing is Getting Closer
Japan just handed XRP bulls a major regulatory tailwind. XRP price is retesting a congestion zone, and the prediction could turn b...

Ripple chases AI’s machine economy as XRPL stablecoins near $1 billion
Stablecoin liquidity on the XRP Ledger (XRPL) has nearly doubled over the past month, putting the network within reach of a $1 bil...

Kraken Becomes Official Crypto Exchange Supporter Of FIFA World Cup 2026
TL;DR Kraken says it has become the Official Crypto Exchange Supporter of the FIFA World Cup 2026. The tournament expands to 48 te...

XRP Price Prediction: Japan Regulates Crypto like Stocks, XRP to Benefit First
Japan just rewrote the rules. XRP price is battling below resistance at $1.10, but it’s prediction is getting bullish as Japan’s p...
ETH futures traders increase long positions as Ether nears $2K lows
Increased long positions amid ETH's price drop highlight market uncertainty, with potential for significant volatility and liquida...