Bitcoin Price Rebound Accelerates, Traders Eye Strong Upside Continuation
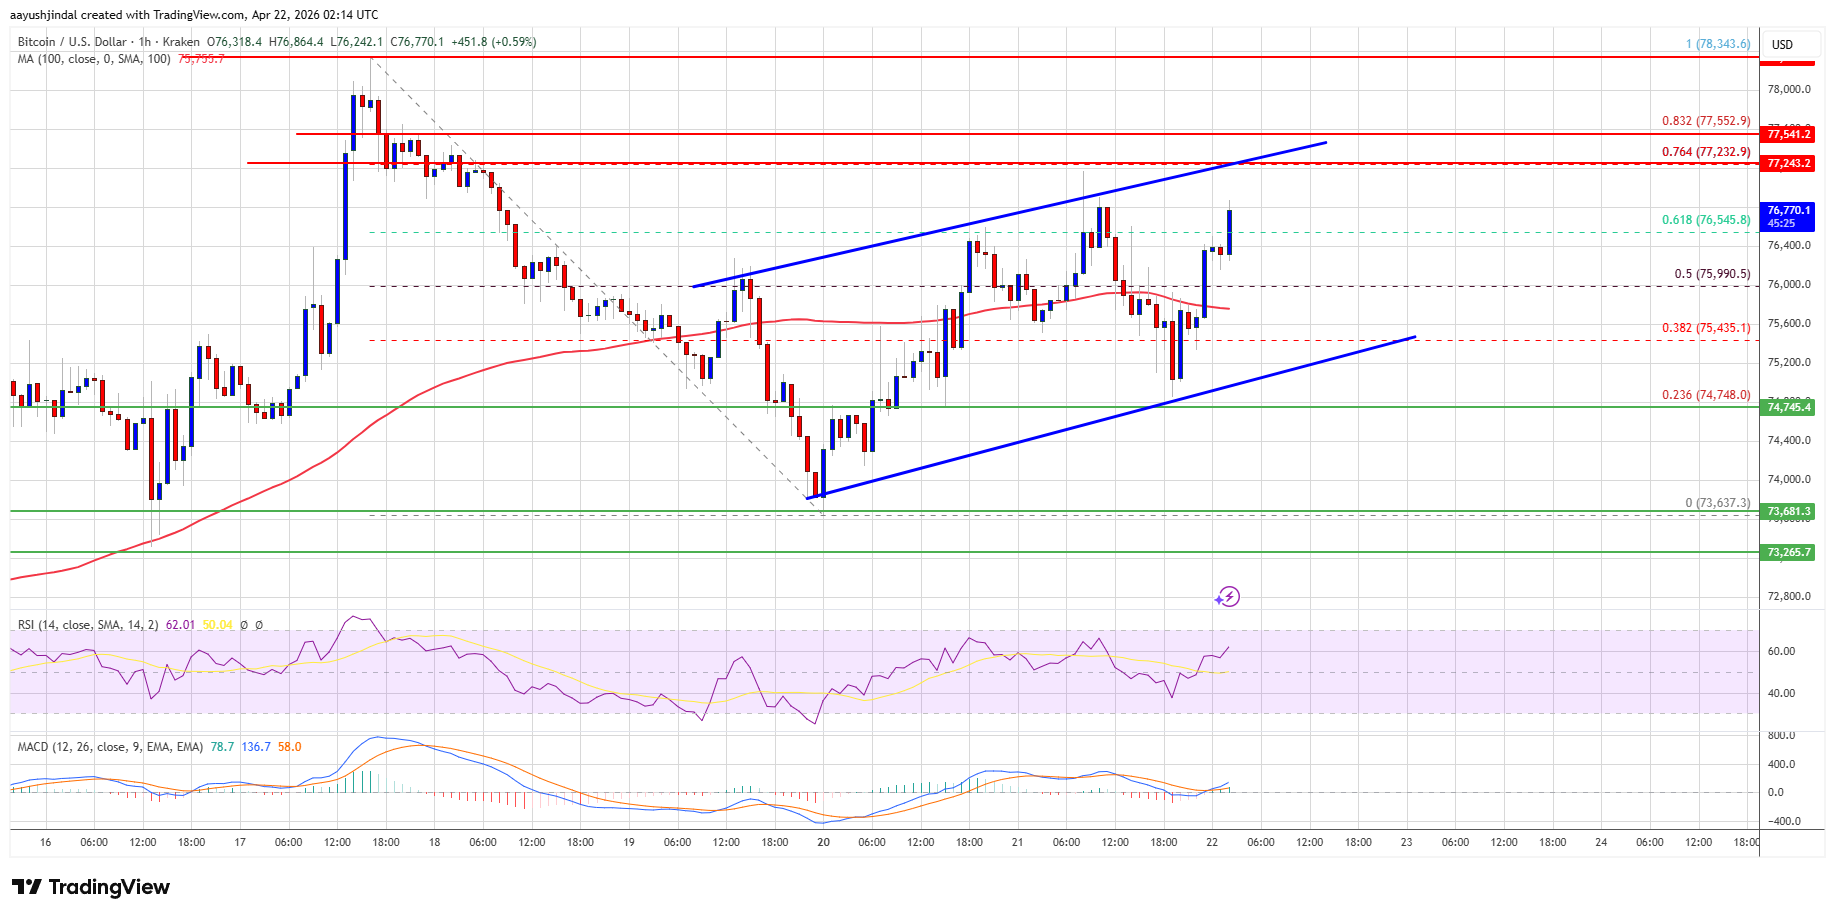
Bitcoin price started a recovery wave above the $75,000 zone. BTC is consolidating and might aim for more gains if it clears the $77,350 resistance zone. Bitcoin managed to form a base above $74,500 and started a recover...
Archive context
Older archive item. Useful for background and entity history, but not a fresh market-moving signal.

Bitcoin price started a recovery wave above the $75,000 zone. BTC is consolidating and might aim for more gains if it clears the $77,350 resistance zone.
- Bitcoin managed to form a base above $74,500 and started a recovery wave.
- The price is trading above $75,500 and the 100 hourly simple moving average.
- There is a rising channel forming with resistance at $77,350 on the hourly chart of the BTC/USD pair (data feed from Kraken).
- The pair might gain bullish momentum if it settles above the $77,500 zone.
Bitcoin price remained supported above the $74,000 zone. BTC formed a base and settled above $74,500 to start a recovery wave. There was a move above the $75,000 and $75,500 levels.
The bulls were able to push the price above the 61.8% Fib retracement level of the downward move from the $78,344 swing high to the $73,637 low. There is also a rising channel forming with resistance at $77,350 on the hourly chart of the BTC/USD pair.
Bitcoin is now trading above $75,500 and the 100 hourly simple moving average. If the price remains stable above $75,000, it could attempt a fresh increase. Immediate resistance is near the $77,250 level and the 76.4% Fib retracement level of the downward move from the $78,344 swing high to the $73,637 low.
The first key resistance is near the $77,350 level. A close above the $77,350 resistance might send the price further higher. In the stated case, the price could rise and test the $78,000 resistance. Any more gains might send the price toward the $78,500 level. The next barrier for the bulls could be $80,000.
Another Decline In BTC?If Bitcoin fails to rise above the $77,350 resistance zone, it could start another decline. Immediate support is near the $76,000 level.
The first major support is near the $75,650 level. The next support is now near the $75,400 zone. Any more losses might send the price toward the $74,250 support in the near term. The main support now sits at $73,200, below which BTC might struggle to recover in the near term.
Technical indicators:
Hourly MACD – The MACD is now gaining pace in the bullish zone.
Hourly RSI (Relative Strength Index) – The RSI for BTC/USD is now above the 50 level.
Major Support Levels – $76,000, followed by $75,400.
Major Resistance Levels – $77,250 and $78,000.
Why this matters
Bitcoin is showing up inside the Layer 2 theme, so this story is worth tracking for follow-through rather than treating it as a one-off headline.
Original source
Read on NewsBTCRelated market context

Ethereum (ETH) Price Prediction: ETH Slips Below Key Support as Traders Watch $1,510 Downside Risk
Ethereum price is once again at a critical turning point as the second-largest cryptocurrency struggles to hold a key support zone...

Ethereum (ETH) Price Prediction: $2,000 or $1,680 Next as ETH Reaches a Critical Turning Point
Ethereum price has fallen back below $1,900 after buyers failed to maintain the latest recovery, leaving ETH positioned between an...

Ethereum just outpaced Bitcoin with $365 million in ETF inflows, but on-chain data shows the real bottom isn’t in yet
Ethereum outpaced Bitcoin in July as stronger investment-product demand and corporate accumulation powered its first sustained rel...

Michael Saylor Posts ‘Bitcoin Drive Engaged,’ Highlights 200-Week Moving Average as Key Bitcoin Level
The comments come as BTC trades close to the four-year trend indicator, while Strategy’s continued focus on its Bitcoin treasury k...

Bitcoin (BTC) Price Prediction: TD Sequential Sell Signal and Weak August History Raise Pullback Risks
The latest market snapshots show Bitcoin trading near $63,000–$64,000, with traders watching whether support around $62,800 can ho...

If Bitcoin breaks $62k over the weekend, a $1.1B short overhang stands ready to pull price down to $60k
Bitcoin enters the weekend near $62,900, less than 1% above the July 31 intraday low, and Deribit has already settled roughly $9.6...