Bitcoin Price Rebounds, But Could the Downtrend Return?
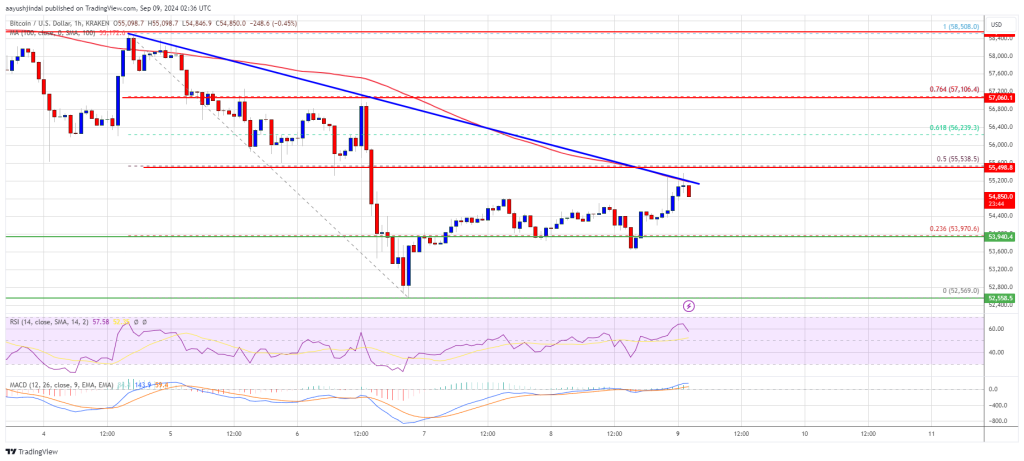
Bitcoin price remained supported near the $52,500 zone. BTC is recovering losses and facing hurdles near the $55,200 and $55,500 levels. Bitcoin is struggling to recover above the $55,500 zone. The price is trading below...
Archive context
Older archive item. Useful for background and entity history, but not a fresh market-moving signal.

Bitcoin price remained supported near the $52,500 zone. BTC is recovering losses and facing hurdles near the $55,200 and $55,500 levels.
- Bitcoin is struggling to recover above the $55,500 zone.
- The price is trading below $55,200 and the 100 hourly Simple moving average.
- There is a key bearish trend line forming with resistance at $55,200 on the hourly chart of the BTC/USD pair (data feed from Kraken).
- The pair could struggle to recover above the $55,500 or $56,000 resistance levels in the near term.
Bitcoin price remained in a bearish zone and extended losses below the $55,500 support zone. BTC even declined below the $53,200 level. It tested the $52,500 zone. A low was formed at $52,569 and the price is now attempting a recovery wave.
There was a move above the $53,200 and $54,000 resistance levels. It cleared the 23.6% Fib retracement level of the downward move from the $58,508 swing high to the $52,569 low. However, the price is now struggling to recover above the $55,500 zone.
Bitcoin is now trading below $55,200 and the 100 hourly Simple moving average. On the upside, the price could face resistance near the $55,200 level. There is also a key bearish trend line forming with resistance at $55,200 on the hourly chart of the BTC/USD pair.
The trend line is close to the 50% Fib retracement level of the downward move from the $58,508 swing high to the $52,569 low. The first key resistance is near the $55,500 level. A clear move above the $55,500 resistance might send the price further higher in the coming sessions.
The next key resistance could be $56,200. A close above the $56,200 resistance might spark more upsides. In the stated case, the price could rise and test the $57,500 resistance.
Another Decline In BTC?If Bitcoin fails to rise above the $55,500 resistance zone, it could start another decline. Immediate support on the downside is near the $54,000 level.
The first major support is $53,200. The next support is now near the $52,500 zone. Any more losses might send the price toward the $51,800 support in the near term.
Technical indicators:
Hourly MACD – The MACD is now losing pace in the bullish zone.
Hourly RSI (Relative Strength Index) – The RSI for BTC/USD is now above the 50 level.
Major Support Levels – $54,000, followed by $53,200.
Major Resistance Levels – $55,200, and $55,500.
Why this matters
This bitcoin story adds another data point to the current market tape and is useful when read alongside nearby source coverage.
Original source
Read on NewsBTCRelated market context

Ethereum (ETH) Price Prediction: ETH Holds Near $1,780 as Bulls Eye $1,860–$1,950, but $1,609 Remains Key Invalidation
Ethereum price is trading near $1,779 after a mixed 24-hour session, according to Brave New Coin data. ETH is down around 0.76% on...

Solana Price Prediction: SOL Holds Near $81 as Breakout Setup Points to $87, but Whale Flows Keep Risk Active
Solana price is back in focus after a sharp recovery pushed SOL towards the $81 area. The move has improved short-term momentum, e...

Bitcoin Price Eyes Recovery After END-OF-CYCLE STRC Shock, Bitwise CIO Says Strategy Will Be ‘Less Important’ Next BTC Cycle
While improving macroeconomic conditions have supported a modest Bitcoin price rebound, Bitwise Chief Investment Officer Matt Houg...

Bitcoin whales send 49,000 BTC to exchanges as $60K rebound shows signs of weakness
Bitcoin’s recovery above $60,000 is facing a fresh test from exchange-flow and derivatives data after large holders moved one of t...

Hyperliquid (HYPE) Price Prediction: Symmetrical Triangle Breakout Puts $77 Target Back in Focus
The breakout comes after several sessions of price compression, with HYPE continuing to trade within a broader technical structure...

XRP Price Prediction: SuperTrend Buy Signal Meets Shrinking Supply as $1.24 Breakout Comes Into Focus
After a fresh SuperTrend buy signal appeared on the 4-hour chart, analysts are watching whether the XRP price can extend its recen...