Bitcoin Price Rebounds, But Key Hurdles Could Stall Progress
Bitcoin price started a recovery wave from the $57,200 zone. BTC is rising, but it might struggle to surpass the $60,200 and $61,150 resistance levels. Bitcoin is attempting a recovery wave above the $58,000 support zone...
Archive context
Older archive item. Useful for background and entity history, but not a fresh market-moving signal.

Bitcoin price started a recovery wave from the $57,200 zone. BTC is rising, but it might struggle to surpass the $60,200 and $61,150 resistance levels.
- Bitcoin is attempting a recovery wave above the $58,000 support zone.
- The price is trading above $58,000 and the 100 hourly Simple moving average.
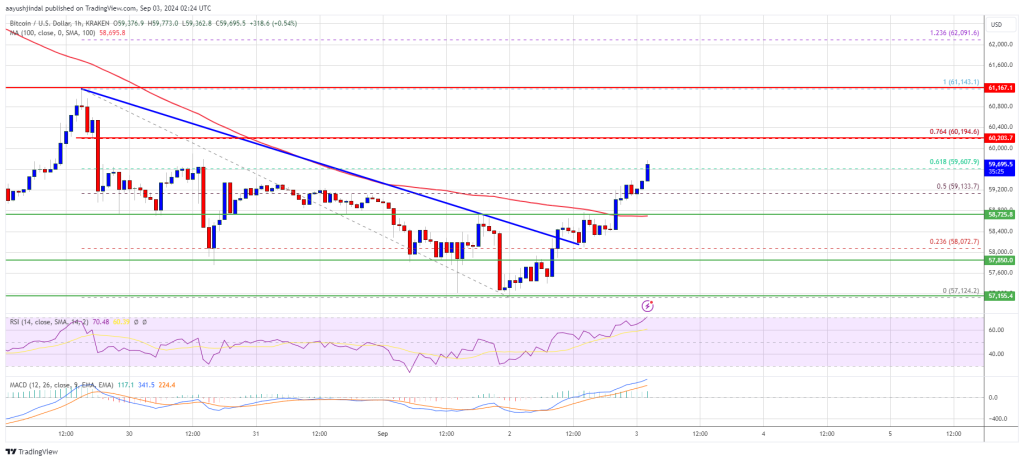
- There was a break above a connecting bearish trend line with resistance at $58,350 on the hourly chart of the BTC/USD pair (data feed from Kraken).
- The pair could face heavy resistance at $60,200 or $61,150 in the near term.
Bitcoin price extended losses below the $58,500 support levels. BTC even spiked below $57,200. A low was formed at $57,124 and the price recently started a recovery wave.
There was a move above the $58,000 and $58,200 resistance levels. It cleared the 50% Fib retracement level of the downward move from the $61,143 swing high to the $57,124 low. There was also a break above a connecting bearish trend line with resistance at $58,350 on the hourly chart of the BTC/USD pair.
Bitcoin is now trading above $58,000 and the 100 hourly Simple moving average. On the upside, the price could face resistance near the $60,200 level or the 76.4% Fib retracement level of the downward move from the $61,143 swing high to the $57,124 low.
The first key resistance is near the $61,150 level. A clear move above the $61,150 resistance might send the price further higher in the coming sessions. The next key resistance could be $62,000. A close above the $62,000 resistance might spark more upsides. In the stated case, the price could rise and test the $65,000 resistance.
Another Decline In BTC?If Bitcoin fails to rise above the $60,200 resistance zone, it could start another decline. Immediate support on the downside is near the $58,750 level.
The first major support is $58,500. The next support is now near the $57,200 zone. Any more losses might send the price toward the $56,200 support in the near term.
Technical indicators:
Hourly MACD – The MACD is now gaining pace in the bullish zone.
Hourly RSI (Relative Strength Index) – The RSI for BTC/USD is now above the 50 level.
Major Support Levels – $58,750, followed by $58,500.
Major Resistance Levels – $60,200, and $61,150.
Why this matters
This bitcoin story adds another data point to the current market tape and is useful when read alongside nearby source coverage.
Original source
Read on NewsBTCRelated market context

Ethereum (ETH) Price Prediction: ETH Holds Near $1,780 as Bulls Eye $1,860–$1,950, but $1,609 Remains Key Invalidation
Ethereum price is trading near $1,779 after a mixed 24-hour session, according to Brave New Coin data. ETH is down around 0.76% on...

Solana Price Prediction: SOL Holds Near $81 as Breakout Setup Points to $87, but Whale Flows Keep Risk Active
Solana price is back in focus after a sharp recovery pushed SOL towards the $81 area. The move has improved short-term momentum, e...

Ether leads crypto's hold above key levels as bitcoin steadies over $63,000
A stalling rebound in AI and chip stocks and a stronger dollar kept the mood cautious as the second half gets underway.

XRP Price Prediction: SuperTrend Buy Signal Meets Shrinking Supply as $1.24 Breakout Comes Into Focus
After a fresh SuperTrend buy signal appeared on the 4-hour chart, analysts are watching whether the XRP price can extend its recen...

Dormant $1.9M Bitcoin tied to New York lawsuit moves after nearly 15 years
A Bitcoin address dormant for nearly 15 years moved $1.9 million in BTC as a New York lawsuit seeks ownership of thousands of inac...

Hyperliquid (HYPE) Price Prediction: Symmetrical Triangle Breakout Puts $77 Target Back in Focus
The breakout comes after several sessions of price compression, with HYPE continuing to trade within a broader technical structure...