Bitcoin Price Recovery Loses Strength, Traders Watch $90K as Last Line of Defense
Bitcoin price started a recovery wave above $88,000. BTC is now struggling and might face hurdles near the $89,500 zone and $90,000. Bitcoin started a recovery wave and climbed toward $89,000. The price is trading above...
Archive context
Older archive item. Useful for background and entity history, but not a fresh market-moving signal.

Bitcoin price started a recovery wave above $88,000. BTC is now struggling and might face hurdles near the $89,500 zone and $90,000.
- Bitcoin started a recovery wave and climbed toward $89,000.
- The price is trading above $86,000 and the 100 hourly Simple moving average.
- There is a bearish trend line forming with resistance at $89,000 on the hourly chart of the BTC/USD pair (data feed from Kraken).
- The pair might continue to move down if it settles below the $86,000 zone.
Bitcoin price managed to stay above the $82,000 level. BTC formed a base and recently started a recovery wave above the $85,000 resistance zone.
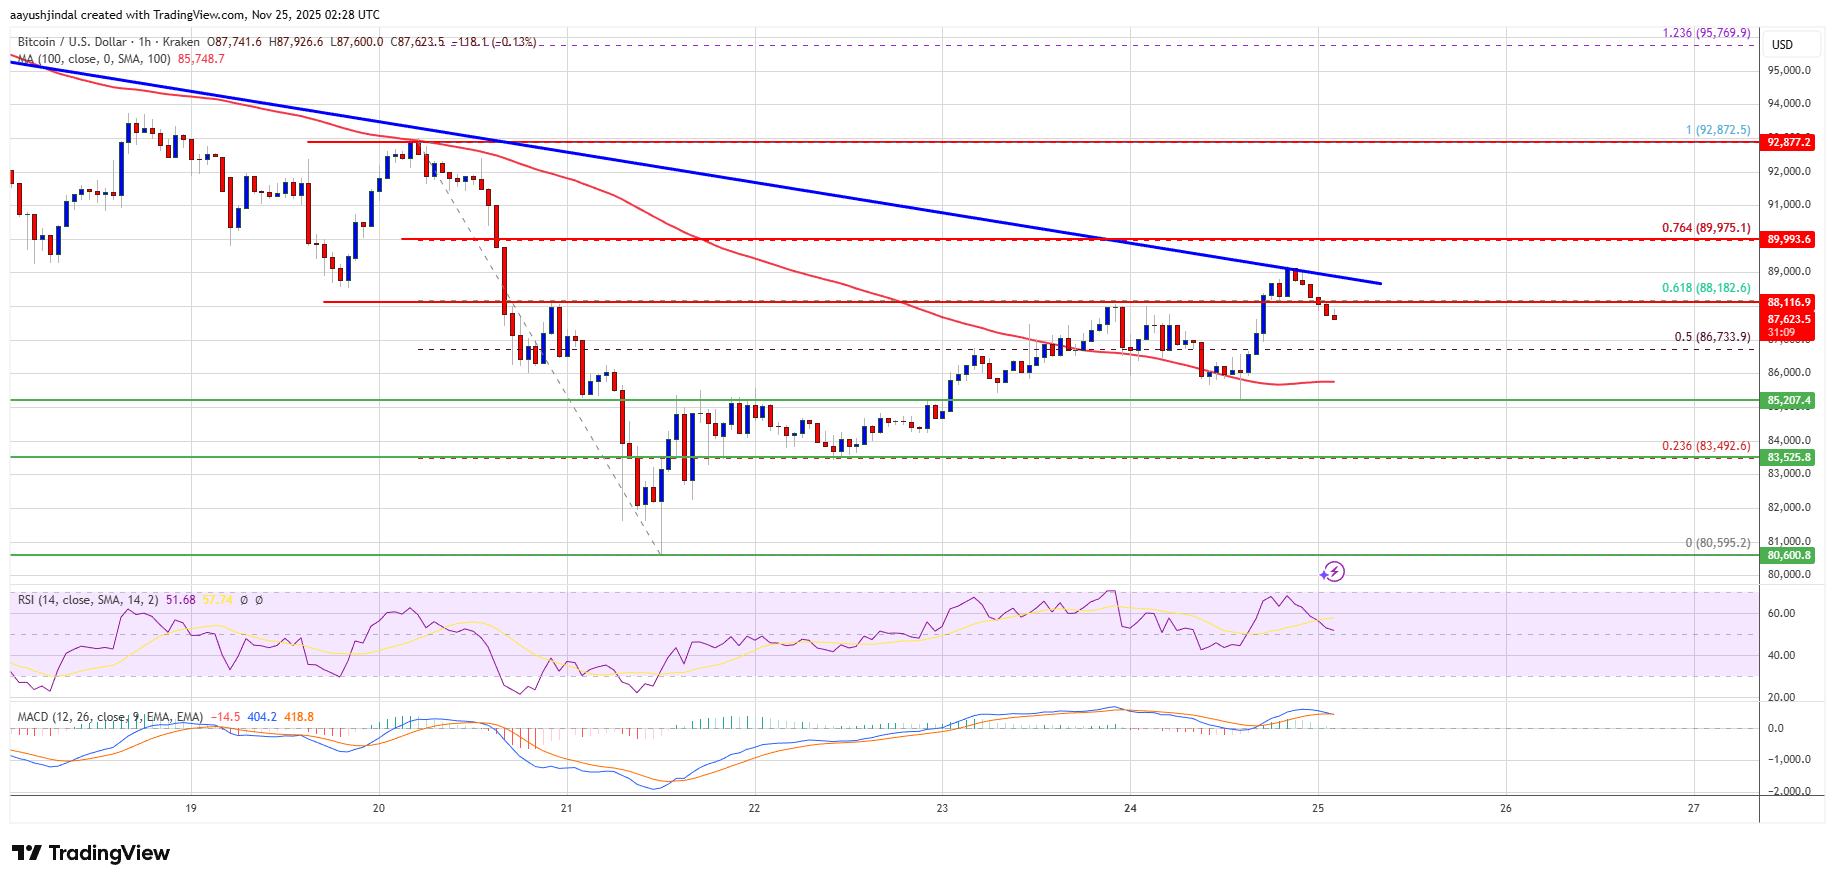
There was a move above the $86,500 resistance zone. The bulls pushed the price above the 50% Fib retracement level of the downward move from the $92,872 swing high to the $80,595 low. However, the bears seem to be active below the $90,000 zone.
Besides, there is a bearish trend line forming with resistance at $89,000 on the hourly chart of the BTC/USD pair. Bitcoin is now trading above $87,000 and the 100 hourly Simple moving average.
If the bulls attempt another recovery wave, the price could face resistance near the $88,500 level. The first key resistance is near the $89,000 level and the trend line. The next resistance could be $90,000 or the 76.4% Fib retracement level of the downward move from the $92,872 swing high to the $80,595 low.
A close above the $90,000 resistance might send the price further higher. In the stated case, the price could rise and test the $92,500 resistance. Any more gains might send the price toward the $93,200 level. The next barrier for the bulls could be $94,500 and $95,000.
Another Decline In BTC?If Bitcoin fails to rise above the $89,000 resistance zone, it could start another decline. Immediate support is near the $86,750 level. The first major support is near the $86,000 level.
The next support is now near the $83,500 zone. Any more losses might send the price toward the $82,500 support in the near term. The main support sits at $80,000, below which BTC might accelerate lower in the near term.
Technical indicators:
Hourly MACD – The MACD is now losing pace in the bullish zone.
Hourly RSI (Relative Strength Index) – The RSI for BTC/USD is now above the 50 level.
Major Support Levels – $86,000, followed by $83,500.
Major Resistance Levels – $89,000 and $90,000.
Why this matters
This bitcoin story adds another data point to the current market tape and is useful when read alongside nearby source coverage.
Original source
Read on NewsBTCRelated market context

Ethereum (ETH) Price Prediction: ETH Holds Near $1,780 as Bulls Eye $1,860–$1,950, but $1,609 Remains Key Invalidation
Ethereum price is trading near $1,779 after a mixed 24-hour session, according to Brave New Coin data. ETH is down around 0.76% on...

Solana Price Prediction: SOL Holds Near $81 as Breakout Setup Points to $87, but Whale Flows Keep Risk Active
Solana price is back in focus after a sharp recovery pushed SOL towards the $81 area. The move has improved short-term momentum, e...

The CLARITY Act Missed Its July 4 Deadline. Is Crypto Screwed?
There is a version of 2026 in which the United States finally settled the question that has defined a decade of crypto litigation...

Bitcoin Price Prediction: Saylor’s Strategy is a Risk to Bitcoin, According to JP Morgan
JPMorgan has flagged a structural risk most Bitcoin price prediction bulls haven’t priced in: the same entity driving the most agg...

XRP Price Prediction: SuperTrend Buy Signal Meets Shrinking Supply as $1.24 Breakout Comes Into Focus
After a fresh SuperTrend buy signal appeared on the 4-hour chart, analysts are watching whether the XRP price can extend its recen...

Hyperliquid (HYPE) Price Prediction: Symmetrical Triangle Breakout Puts $77 Target Back in Focus
The breakout comes after several sessions of price compression, with HYPE continuing to trade within a broader technical structure...