Bitcoin Price Recovery Near Resistance, Breakout Or Rejection Next?
Bitcoin price started a recovery wave above the $76,500 zone. BTC is consolidating and might aim for more gains if it clears the $76,750 resistance zone. Bitcoin managed to form a base above $75,000 and started a recover...
Archive context
Older archive item. Useful for background and entity history, but not a fresh market-moving signal.

Bitcoin price started a recovery wave above the $76,500 zone. BTC is consolidating and might aim for more gains if it clears the $76,750 resistance zone.
- Bitcoin managed to form a base above $75,000 and started a recovery wave.
- The price is trading below $77,000 and the 100 hourly simple moving average.
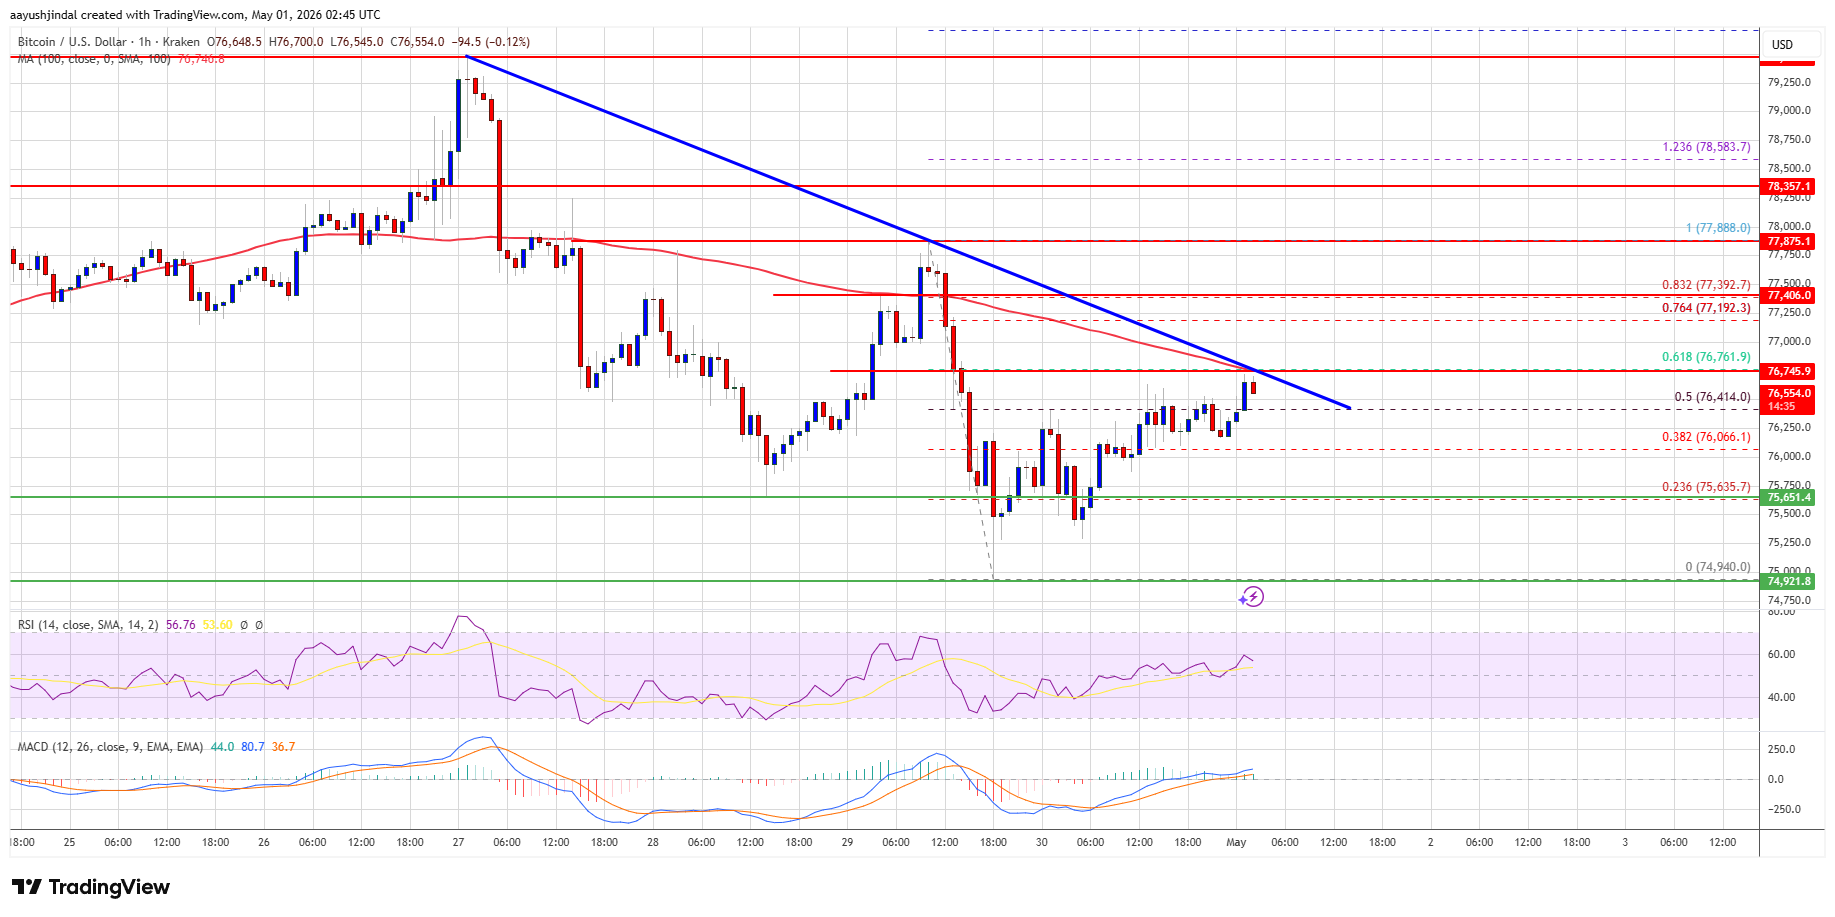
- There is a bearish trend line forming with resistance at $76,750 on the hourly chart of the BTC/USD pair (data feed from Kraken).
- The pair might gain bullish momentum if it settles above the $77,000 zone.
Bitcoin price remained supported above the $75,000 zone. BTC formed a base and settled above $75,500 to start a recovery wave. There was a move above the $76,000 and $76,200 levels.
The bulls were able to push the price above the 50% Fib retracement level of the downward move from the $77,888 swing high to the $74,940 low. However, the bears are active near $76,750. There is also a bearish trend line forming with resistance at $76,750 on the hourly chart of the BTC/USD pair.
Bitcoin is now trading below $77,000 and the 100 hourly simple moving average. If the price remains stable above $75,500, it could attempt a fresh increase. Immediate resistance is near the $76,750 level, the trend line, and the 61.8% Fib retracement level of the downward move from the $77,888 swing high to the $74,940 low.
The first key resistance is near the $77,000 level. A close above the $77,000 resistance might send the price further higher. In the stated case, the price could rise and test the $78,000 resistance. Any more gains might send the price toward the $78,500 level. The next barrier for the bulls could be $80,000.
Another Decline In BTC?If Bitcoin fails to rise above the $76,750 resistance zone, it could start another decline. Immediate support is near the $76,000 level.
The first major support is near the $75,650 level. The next support is now near the $75,000 zone. Any more losses might send the price toward the $74,250 support in the near term. The main support now sits at $73,200, below which BTC might struggle to recover in the near term.
Technical indicators:
Hourly MACD – The MACD is now gaining pace in the bullish zone.
Hourly RSI (Relative Strength Index) – The RSI for BTC/USD is now above the 50 level.
Major Support Levels – $76,000, followed by $75,650.
Major Resistance Levels – $76,750 and $77,000.
Why this matters
Bitcoin is showing up inside the Layer 2 theme, so this story is worth tracking for follow-through rather than treating it as a one-off headline.
Original source
Read on NewsBTCRelated market context

Ethereum (ETH) Price Prediction: ETH Slips Below Key Support as Traders Watch $1,510 Downside Risk
Ethereum price is once again at a critical turning point as the second-largest cryptocurrency struggles to hold a key support zone...

Ethereum (ETH) Price Prediction: $2,000 or $1,680 Next as ETH Reaches a Critical Turning Point
Ethereum price has fallen back below $1,900 after buyers failed to maintain the latest recovery, leaving ETH positioned between an...

Bitcoin (BTC) Price Prediction: TD Sequential Sell Signal and Weak August History Raise Pullback Risks
The latest market snapshots show Bitcoin trading near $63,000–$64,000, with traders watching whether support around $62,800 can ho...
Bitcoin Price Prediction: Michael Saylor’s Strategy Posts Massive Q2 Loss Despite Bigger Bitcoin Stack
Bitcoin is trading around $63,000 to $65,000 price range, as Strategy’s weak Q2 earnings add pressure to an already cautious marke...

Grok AI Predicts Bitcoin Will Blow Past Its Old Record by End of 2027
Grok AI predicts a major re-rating for Bitcoin, and this price prediction is unusual in its timeframe, targeting the end of 2027 r...

XRP Price Prediction: Japan Just Made It Insanely Easy to Get Free XRP with a Credit Card
Japan just handed XRP holders a mainstream on-ramp that many Western markets still cannot match, and it’s bullish for Ripple’s pri...