Bitcoin Price Regains Strength – Can the Rebound Turn Explosive?
Bitcoin price is recovering from the $112,000 support zone. BTC is rising and might attempt to clear the $115,500 resistance zone to gain bullish momentum. Bitcoin started a decent upward move from the $112,000 zone. The...
Archive context
Older archive item. Useful for background and entity history, but not a fresh market-moving signal.

Bitcoin price is recovering from the $112,000 support zone. BTC is rising and might attempt to clear the $115,500 resistance zone to gain bullish momentum.
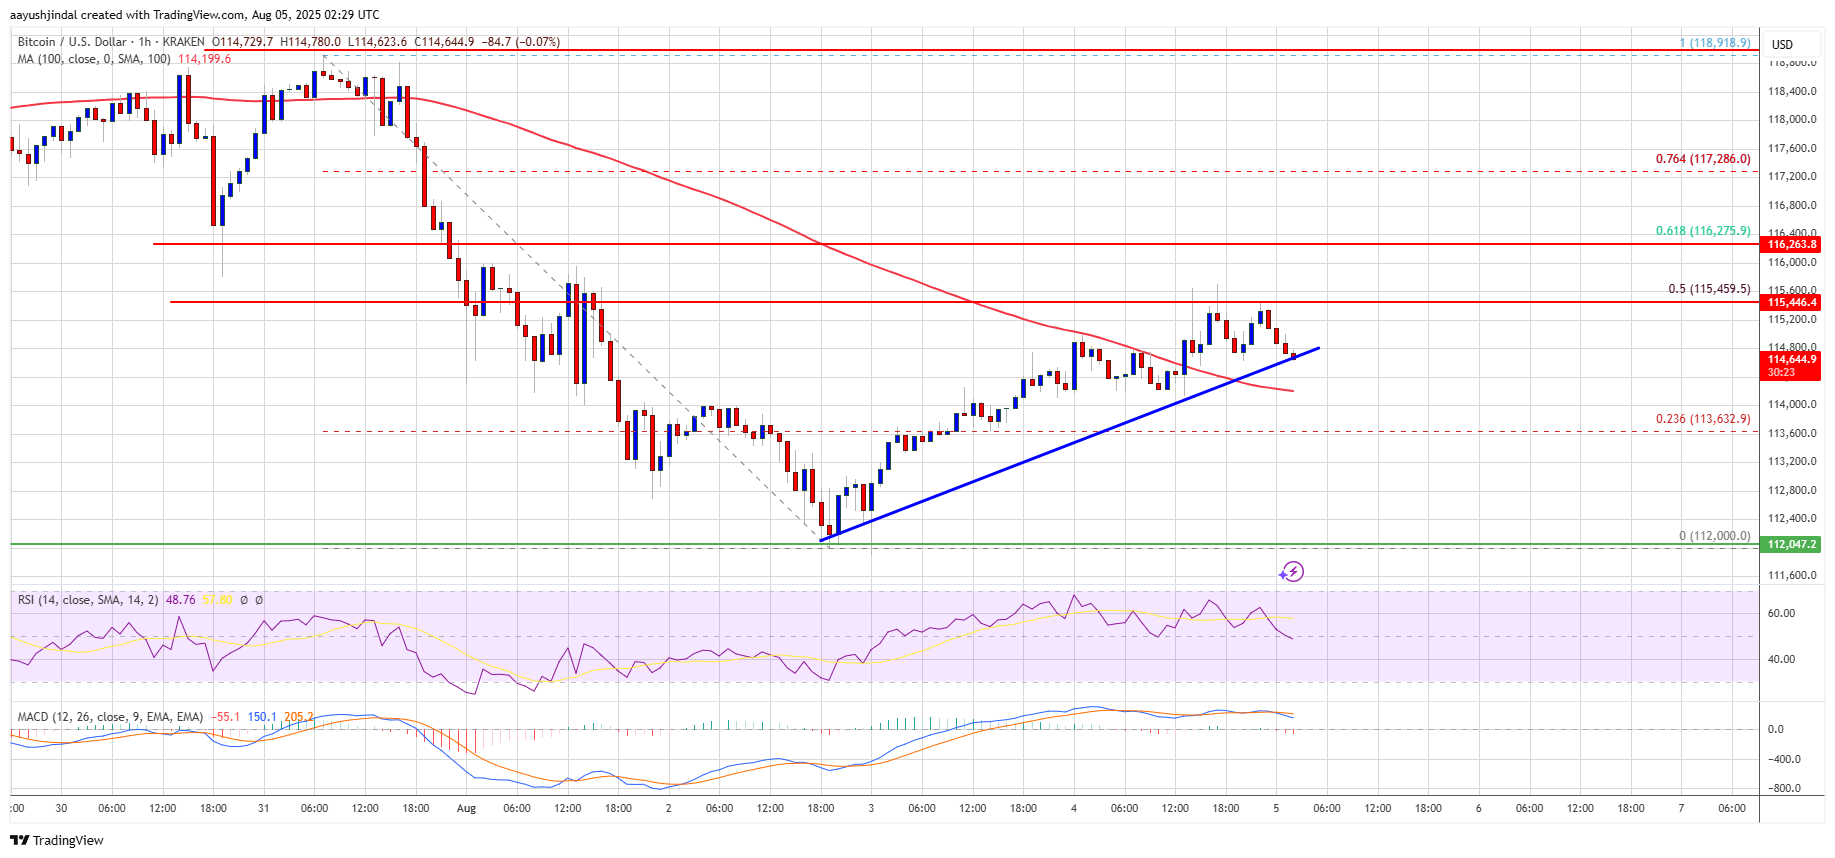
- Bitcoin started a decent upward move from the $112,000 zone.
- The price is trading above $114,000 and the 100 hourly Simple moving average.
- There is a bullish trend line forming with support at $114,600 on the hourly chart of the BTC/USD pair (data feed from Kraken).
- The pair might start another increase if it clears the $115,500 resistance zone.
Bitcoin price started a downward move from the $118,000 zone. BTC declined below the $115,000 and $113,500 support levels to enter a short-term bearish zone.
The price tested the $112,000 zone. A base was formed and the price is now attempting to recover. There was a move above the $113,500 and $114,200 levels. The price surpassed the 23.6% Fib retracement level of the downward move from the $118,918 swing high to the $112,000 low.
Bitcoin is now trading above $114,200 and the 100 hourly Simple moving average. There is also a bullish trend line forming with support at $114,600 on the hourly chart of the BTC/USD pair.
Immediate resistance on the upside is near the $115,500 level. It is close to the 50% Fib retracement level of the downward move from the $118,918 swing high to the $112,000 low. The first key resistance is near the $116,250 level. The next resistance could be $116,800. A close above the $116,800 resistance might send the price further higher. In the stated case, the price could rise and test the $118,500 resistance level. Any more gains might send the price toward the $120,500 level. The main target could be $121,200.
Another Decline In BTC?If Bitcoin fails to rise above the $115,500 resistance zone, it could start another decline. Immediate support is near the $114,600 level. The first major support is near the $113,500 level.
The next support is now near the $112,000 zone. Any more losses might send the price toward the $110,500 support in the near term. The main support sits at $108,500, below which BTC might continue to move down.
Technical indicators:
Hourly MACD – The MACD is now gaining pace in the bullish zone.
Hourly RSI (Relative Strength Index) – The RSI for BTC/USD is now above the 50 level.
Major Support Levels – $114,600, followed by $113,500.
Major Resistance Levels – $115,500 and $116,800.
Why this matters
This bitcoin story adds another data point to the current market tape and is useful when read alongside nearby source coverage.
Original source
Read on NewsBTCRelated market context

XRP Price Prediction: XRP Faces Critical Resistance Near $1.17 Despite Ripple Securing Landmark EU License
While the company secured a full MiCA license that expands its operations across the European Economic Area, market indicators sug...

Bitcoin (BTC) Price Prediction: BTC Holds $63K Support—Can Rising Active Addresses Offset Bearish Technical Signals?
Although the BTC price has remained near a key support zone, recent chart signals and Strategy’s sale of a portion of its Bitcoin...

Ethereum is losing ownership of crypto payments as Base moves $565B in stablecoins
Stablecoin activity is becoming a contest over which blockchains move the most tokenized dollars. Visa Onchain Analytics showed th...

Elon Musk Grok AI Predicts Incredible XRP Price Target by End of 2026
Elon Musk Grok AI just published what might be the most partnership-heavy XRP price prediction in this entire series. The model pr...

Solana’s $8.7B RWA surge shows tokenized assets are finally starting to move
Solana’s real-world asset transfer volume more than doubled over the past month, giving the network a stronger signal that tokeniz...

Bitcoin price rebounds to $63K as leverage returns creating short term volatility risk
Bitcoin's rebound has cleared the first test: price recovered. The harder one starts now: proving buyers remain after the squeeze....