Bitcoin Price Rejected Above $70K, Bulls Lose Grip on Momentum
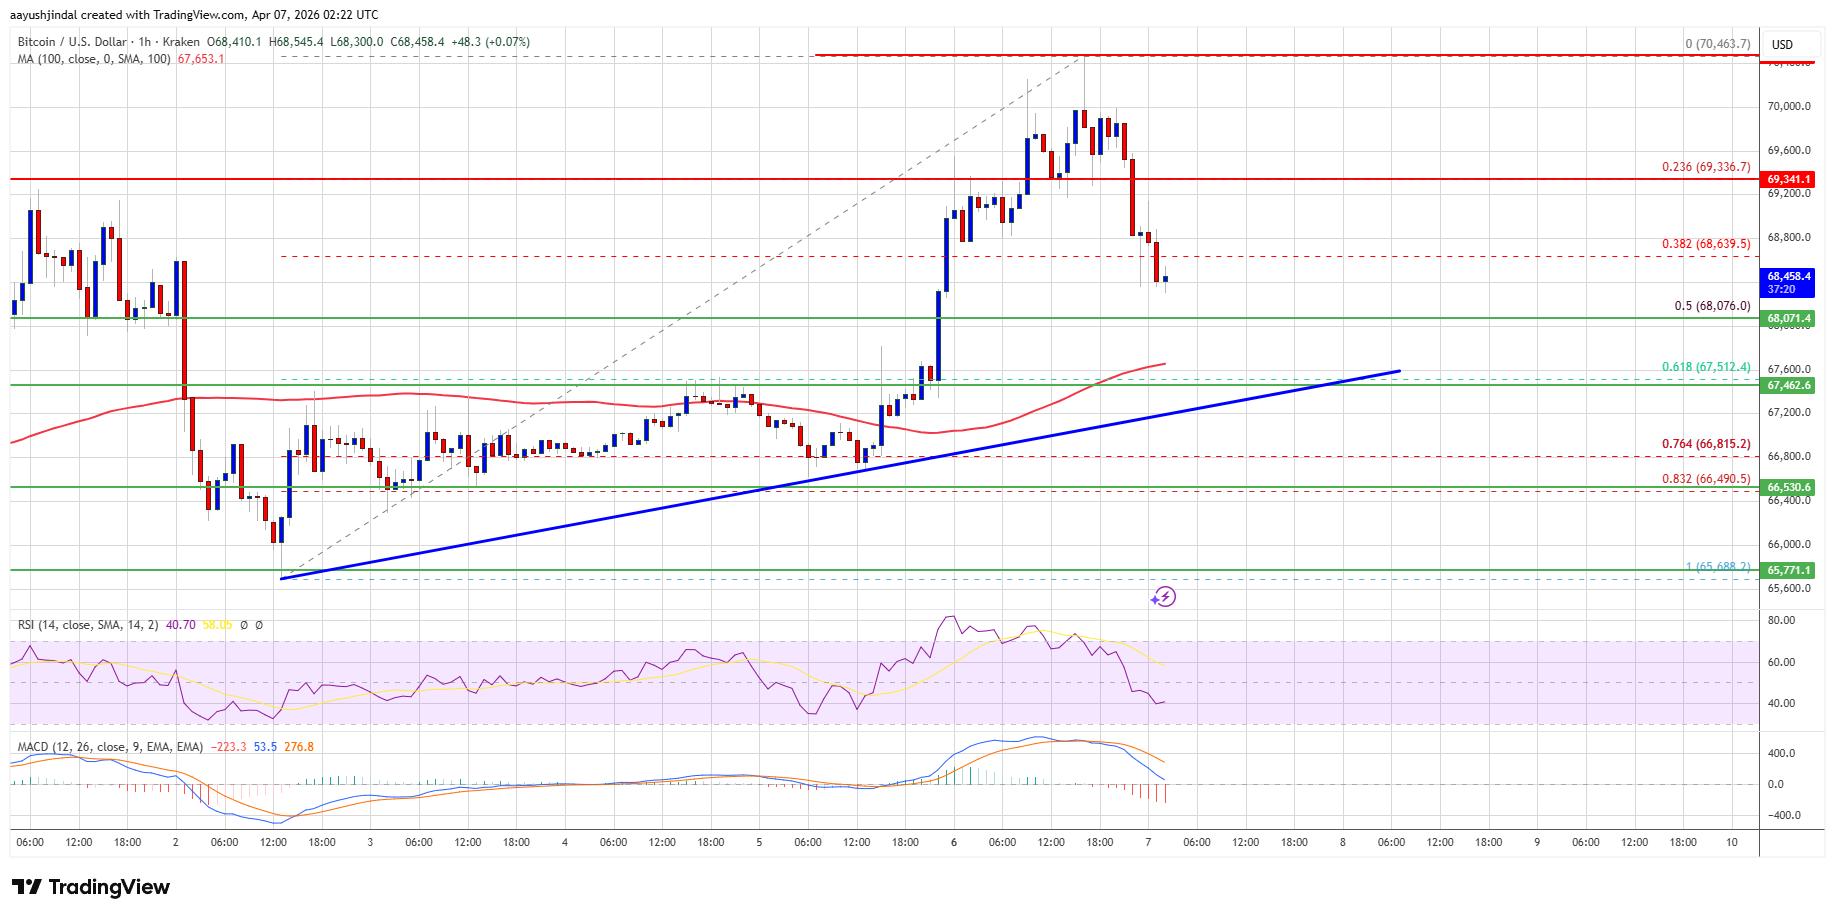
Bitcoin price started a decent increase above the $68,800 zone. BTC is trimming gains and might revisit the $67,500 support zone. Bitcoin gained pace for a move above the $68,500 and $68,800 levels. The price is trading...

Bitcoin price started a decent increase above the $68,800 zone. BTC is trimming gains and might revisit the $67,500 support zone.
- Bitcoin gained pace for a move above the $68,500 and $68,800 levels.
- The price is trading above $68,000 and the 100 hourly simple moving average.
- There is a bullish trend line forming with support at $67,500 on the hourly chart of the BTC/USD pair (data feed from Kraken).
- The pair might extend losses if it stays below the $69,250 and $69,500 levels.
Bitcoin price managed to climb higher above the $68,000 resistance zone. BTC gained pace for a move above the $68,500 and $68,800 levels.
The price even climbed above $70,000 but failed to remain in a positive zone. A high was formed at $70,463, and the price started a downside correction. There was a move below the 23.6% Fib retracement level of the upward move from the $65,688 swing low to the $70,463 high.
Bitcoin is now trading above $68,000 and the 100 hourly simple moving average. There is also a bullish trend line forming with support at $67,500 on the hourly chart of the BTC/USD pair.
If the price remains stable above $67,500, it could attempt a fresh increase. Immediate resistance is near the $69,350 level. The first key resistance is near the $69,800 level. A close above the $69,800 resistance might send the price further higher. In the stated case, the price could rise and test the $70,500 resistance. Any more gains might send the price toward the $71,500 level. The next barrier for the bulls could be $72,000.
More Losses In BTC?If Bitcoin fails to rise above the $69,350 resistance zone, it could start another decline. Immediate support is near the $68,000 level. The first major support is near the $67,800 level.
The next support is now near the $67,500 zone or the 61.8% Fib retracement level of the upward move from the $65,688 swing low to the $70,463 high. Any more losses might send the price toward the $66,800 support in the near term. The main support now sits at $65,500, below which BTC might struggle to recover in the near term.
Technical indicators:
Hourly MACD – The MACD is now gaining pace in the bearish zone.
Hourly RSI (Relative Strength Index) – The RSI for BTC/USD is now below the 50 level.
Major Support Levels – $68,000, followed by $67,500.
Major Resistance Levels – $69,350 and $70,500.
Original source
Read on NewsBTCRelated market context

XRP Price Prediction: Japan Regulates Crypto like Stocks, XRP to Benefit First
Japan just rewrote the rules. XRP price is battling below resistance at $1.10, but it’s prediction is getting bullish as Japan’s p...

XRP Price Prediction: Japan XRP ETF Listing is Getting Closer
Japan just handed XRP bulls a major regulatory tailwind. XRP price is retesting a congestion zone, and the prediction could turn b...

Kraken Becomes Official Crypto Exchange Supporter Of FIFA World Cup 2026
TL;DR Kraken says it has become the Official Crypto Exchange Supporter of the FIFA World Cup 2026. The tournament expands to 48 te...

Ethereum Nears 200 Million Non-Empty Wallets Despite Market Uncertainty
Despite persistent market uncertainty and bearish sentiment across parts of the cryptocurrency sector, Ethereum is approaching a s...

XRP aims for $0.90 as ETF demand battles selling pressure from whales
XRP is trading at $1.11, down roughly 17% from its June opening, having set a new 2026 low on June 5 and shed $8 billion in market...

Ripple chases AI’s machine economy as XRPL stablecoins near $1 billion
Stablecoin liquidity on the XRP Ledger (XRPL) has nearly doubled over the past month, putting the network within reach of a $1 bil...