Bitcoin Price Rejects $70K: Post-Fed Recovery Fails to Materialize
Bitcoin price started a strong increase above $68,500. BTC even tested $70,000, but post-fed there was a major bearish reaction. Bitcoin started another decline from the $70,000 resistance zone. The price is trading belo...
Archive context
Older archive item. Useful for background and entity history, but not a fresh market-moving signal.

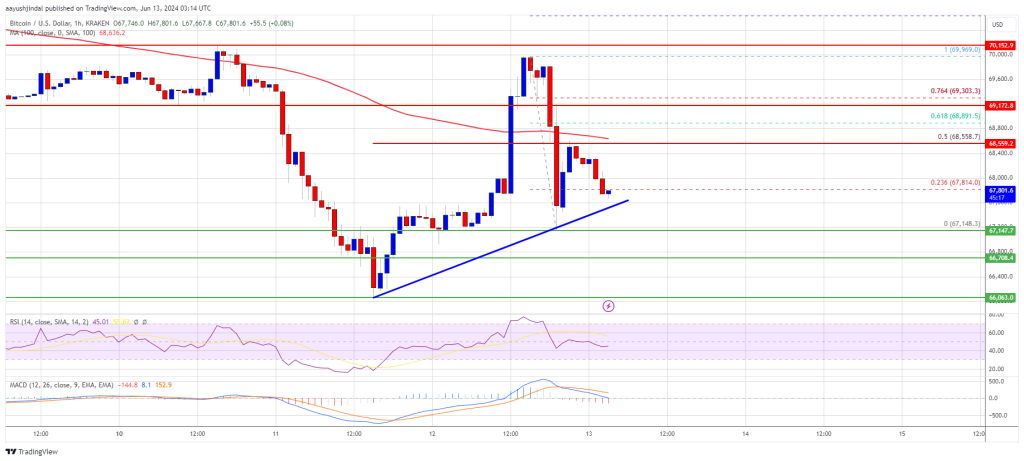
Bitcoin price started a strong increase above $68,500. BTC even tested $70,000, but post-fed there was a major bearish reaction.
- Bitcoin started another decline from the $70,000 resistance zone.
- The price is trading below $68,550 and the 100 hourly Simple moving average.
- There is a connecting bullish trend line forming with support at $67,500 on the hourly chart of the BTC/USD pair (data feed from Kraken).
- The pair could recover but the upsides might be limited above the $68,550 level.
Bitcoin price started a steady increase above the $68,500 resistance zone. BTC even cleared the $69,200 resistance zone. However, after the Fed kept the rates at 5.5%, there was a strong bearish reaction.
The price dipped below the $68,800 and $68,500 levels. The price tested the $67,200 zone. A low was formed at $67,148 and the price is now consolidating losses near the 23.6% Fib retracement level of the downward move from the $69,969 swing high to the $67,148 low.
Bitcoin is now trading below $68,800 and the 100 hourly Simple moving average. There is also a connecting bullish trend line forming with support at $67,500 on the hourly chart of the BTC/USD pair. On the upside, the price is facing resistance near the $68,250 level. The first major resistance could be $68,550 and the 50% Fib retracement level of the downward move from the $69,969 swing high to the $67,148 low.
The next key resistance could be $69,200. A clear move above the $69,200 resistance might send the price higher. In the stated case, the price could rise and test the $70,000 resistance. Any more gains might send BTC toward the $71,200 resistance in the near term.
More Losses In BTC?If Bitcoin fails to climb above the $68,550 resistance zone, it could start another decline. Immediate support on the downside is near the $67,200 level.
The first major support is $67,000. The next support is now forming near $66,000. Any more losses might send the price toward the $65,500 support zone in the near term.
Technical indicators:
Hourly MACD – The MACD is now losing pace in the bearish zone.
Hourly RSI (Relative Strength Index) – The RSI for BTC/USD is now below the 50 level.
Major Support Levels – $67,000, followed by $66,000.
Major Resistance Levels – $68,550, and $69,200.
Why this matters
This bitcoin story adds another data point to the current market tape and is useful when read alongside nearby source coverage.
Original source
Read on NewsBTCRelated market context

XRP Price Prediction: XRP Faces Critical Resistance Near $1.17 Despite Ripple Securing Landmark EU License
While the company secured a full MiCA license that expands its operations across the European Economic Area, market indicators sug...

Bitcoin (BTC) Price Prediction: BTC Holds $63K Support—Can Rising Active Addresses Offset Bearish Technical Signals?
Although the BTC price has remained near a key support zone, recent chart signals and Strategy’s sale of a portion of its Bitcoin...

Bitcoin price rebounds to $63K as leverage returns creating short term volatility risk
Bitcoin's rebound has cleared the first test: price recovered. The harder one starts now: proving buyers remain after the squeeze....

Vitalik Buterin Proposes ‘Extremely Lean’ Ethereum That Cuts Validator State by 95% Using ZK Proofs
Ethereum co-founder Vitalik Buterin published a technical proposal Monday called “The Extremely Lean Chain,” outlining a two-phase...

‘Privacy Is No Longer an Afterthought’: Vitalik Buterin Unveils 3-4 Year Plan to Rebuild Ethereum
Ethereum co-founder Vitalik Buterin has published a “Lean Ethereum” roadmap that would replace nearly every major component of the...

Bitcoin dominance hits one-month low as altcoin winners start breaking away
Bitcoin's dominance dropped to a one-month low of 54%, down from 58.12%, according to CoinGecko's dominance table. Over the same s...