Bitcoin Price Resumes Increase as The Crypto Bulls Take Control
Bitcoin price climbed further higher above $21,000. BTC is rising and might aim a move towards the $22,000 resistance zone in the near term. Bitcoin climbed further higher above the $20,000 and $20,500 resistance levels....
Archive context
Older archive item. Useful for background and entity history, but not a fresh market-moving signal.

Bitcoin price climbed further higher above $21,000. BTC is rising and might aim a move towards the $22,000 resistance zone in the near term.
- Bitcoin climbed further higher above the $20,000 and $20,500 resistance levels.
- The price is trading above $20,200 and the 100 hourly simple moving average.
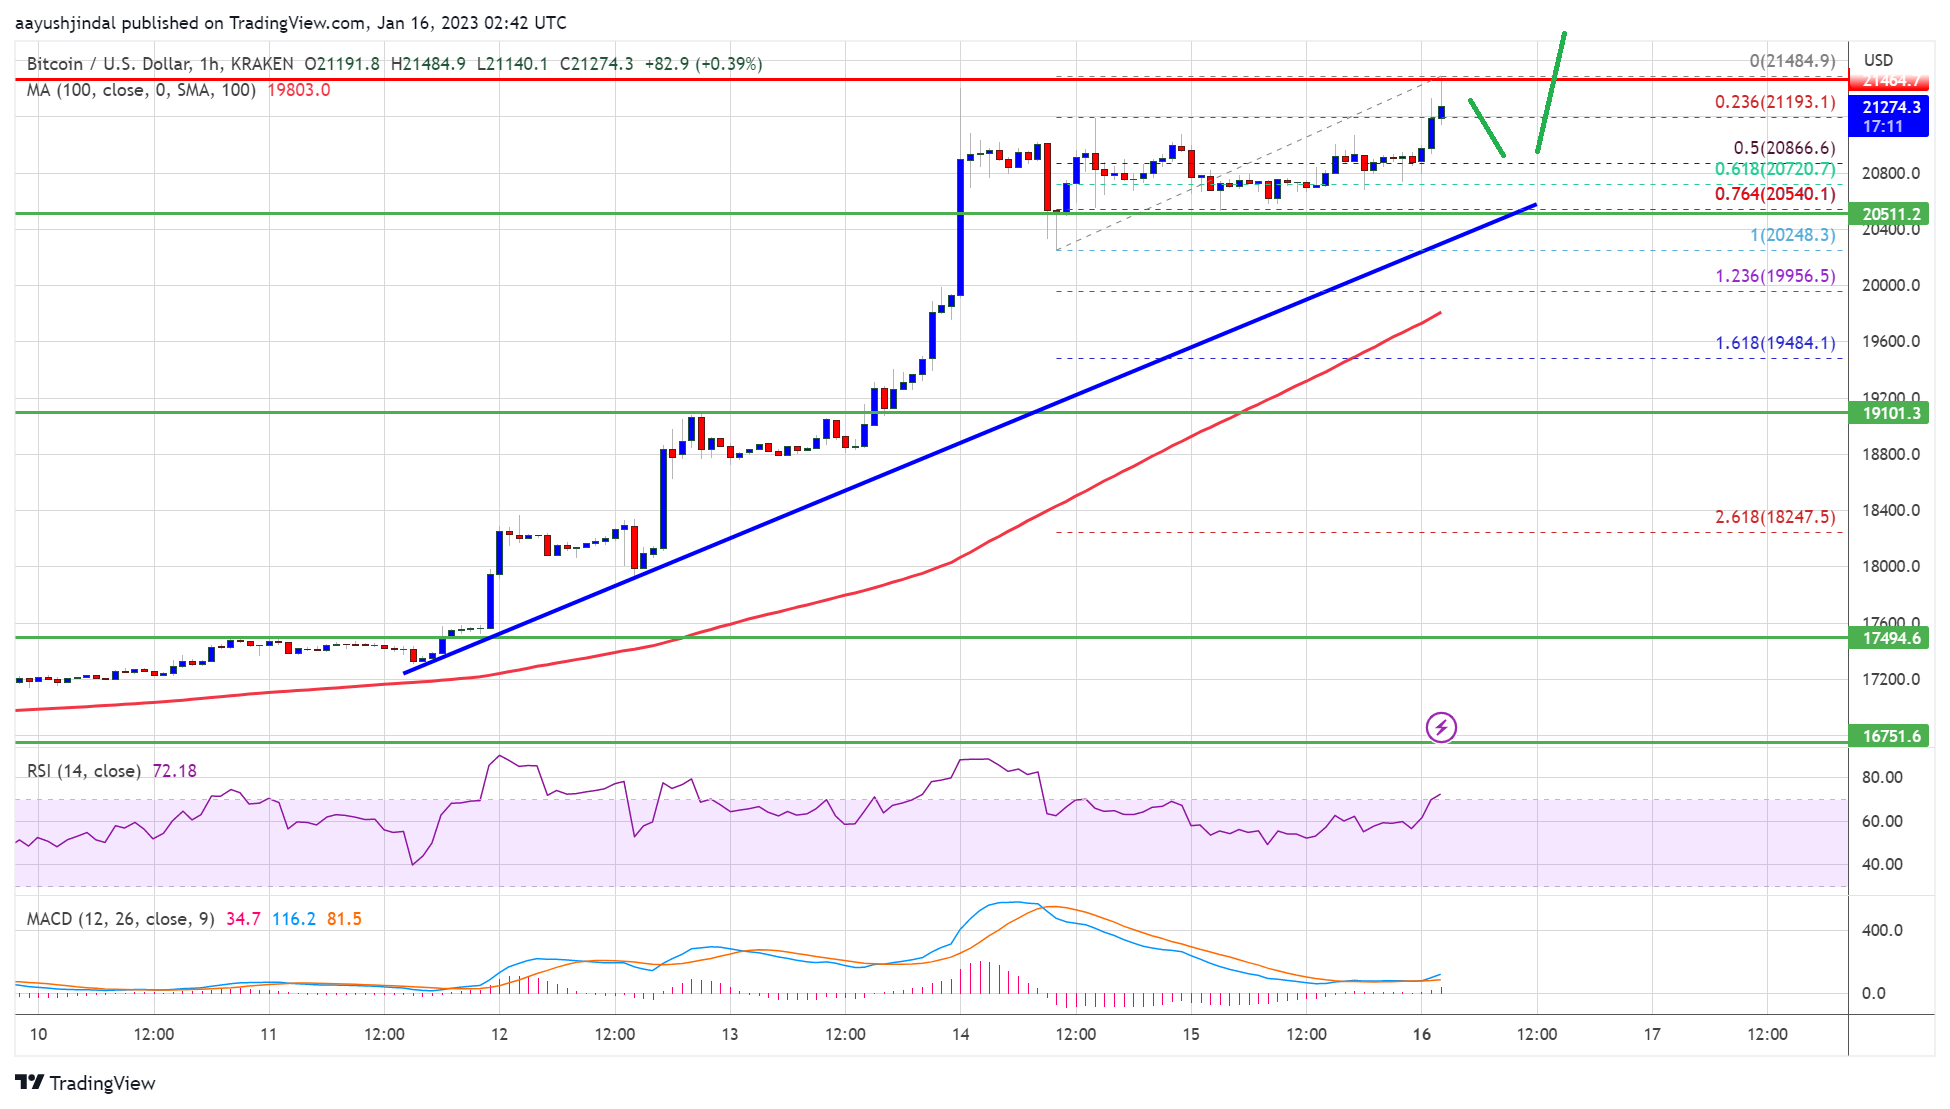
- There is a major bullish trend line forming with support near $20,500 on the hourly chart of the BTC/USD pair (data feed from Kraken).
- The pair could rise further above the $21,500 resistance zone in the near term.
Bitcoin price gained a strong bullish momentum and settled above the $20,000 resistance zone. BTC even climbed above the $20,500 level to move into a positive zone.
The price consolidated for some time above the $20,500 level. A high is formed near $21,484 and the price is now showing signs of more upsides. It is now trading above $20,200 and the 100 hourly simple moving average. There is also a major bullish trend line forming with support near $20,500 on the hourly chart of the BTC/USD pair.
It is also trading above the 23.6% Fib retracement level of the upward move from the $20,248 swing low to $21,484 high. On the upside, an immediate resistance is near the $21,500 level.
Source: BTCUSD on TradingView.com
The next major resistance is near the $21,850 zone, above which the price might start another steady increase. In the stated case, the price may perhaps rise towards the $22,000 level. Any more gains might send btc price towards the $22,500 level.
Downside Correction in BTC?If bitcoin price fails to clear the $21,500 resistance, it could start a downside correction. An immediate support on the downside is near the $21,000 level.
The next major support is near the $20,500 level and the trend line. It is near the 61.8% Fib retracement level of the upward move from the $20,248 swing low to $21,484 high. The main support is now forming near the $20,200 level, below which the price might retest $19,000.
Technical indicators:
Hourly MACD – The MACD is now gaining pace in the bullish zone.
Hourly RSI (Relative Strength Index) – The RSI for BTC/USD is now above the 50 level.
Major Support Levels – $20,500, followed by $20,200.
Major Resistance Levels – $21,500, $22,000 and $22,500.
Why this matters
This bitcoin story adds another data point to the current market tape and is useful when read alongside nearby source coverage.
Original source
Read on NewsBTCRelated market context

Dogecoin Cools Near Support As Meme Traders Wait For A Cleaner Breakout Signal
Dogecoin is back in one of those awkward areas where both bulls and bears can make a case. Price has cooled into support rather th...

XRP Price Prediction: Bears Eye $1 Support as Whale Activity Suddenly Collapses
While Ripple XRP is still holding above the psychologically important $1 level, analysts are closely monitoring whether buyers can...

XRP Price Prediction: Key Metrics Point to a Crash
XRP prediction chatter is heating up even as the price slips, which is usually when markets like to play tricks. XRP trades at aro...

Ethereum (ETH) Price Prediction: ETH Eyes $2,100 as ETF Inflows Return and Whale Demand Builds
Ethereum price is trading near $1,785 after a modest 24-hour recovery, but the market is now watching whether fresh inflows and wh...

Bitcoin Price Prediction: Strategy Has a New BTC Approach
Bitcoin price is trading at $62,900, as we debate whether this pause is simply a reset or something more serious, with bearish pre...

Ripple Crowned: UK Treasury Just Changed Everything for XRP
In the latest XRP news, Ripple Labs has joined the UK HM Treasury’s Wholesale Digital Markets taskforce, a 54-firm initiative that...