Bitcoin Price Retests Support—Is the Market Bracing for Volatility?
Bitcoin price attempted to start a fresh increase but failed at $89,500. BTC is now struggling below $86,500 and might continue to move down. Bitcoin started a fresh decline below the $86,500 zone. The price is trading b...
Archive context
Older archive item. Useful for background and entity history, but not a fresh market-moving signal.

Bitcoin price attempted to start a fresh increase but failed at $89,500. BTC is now struggling below $86,500 and might continue to move down.
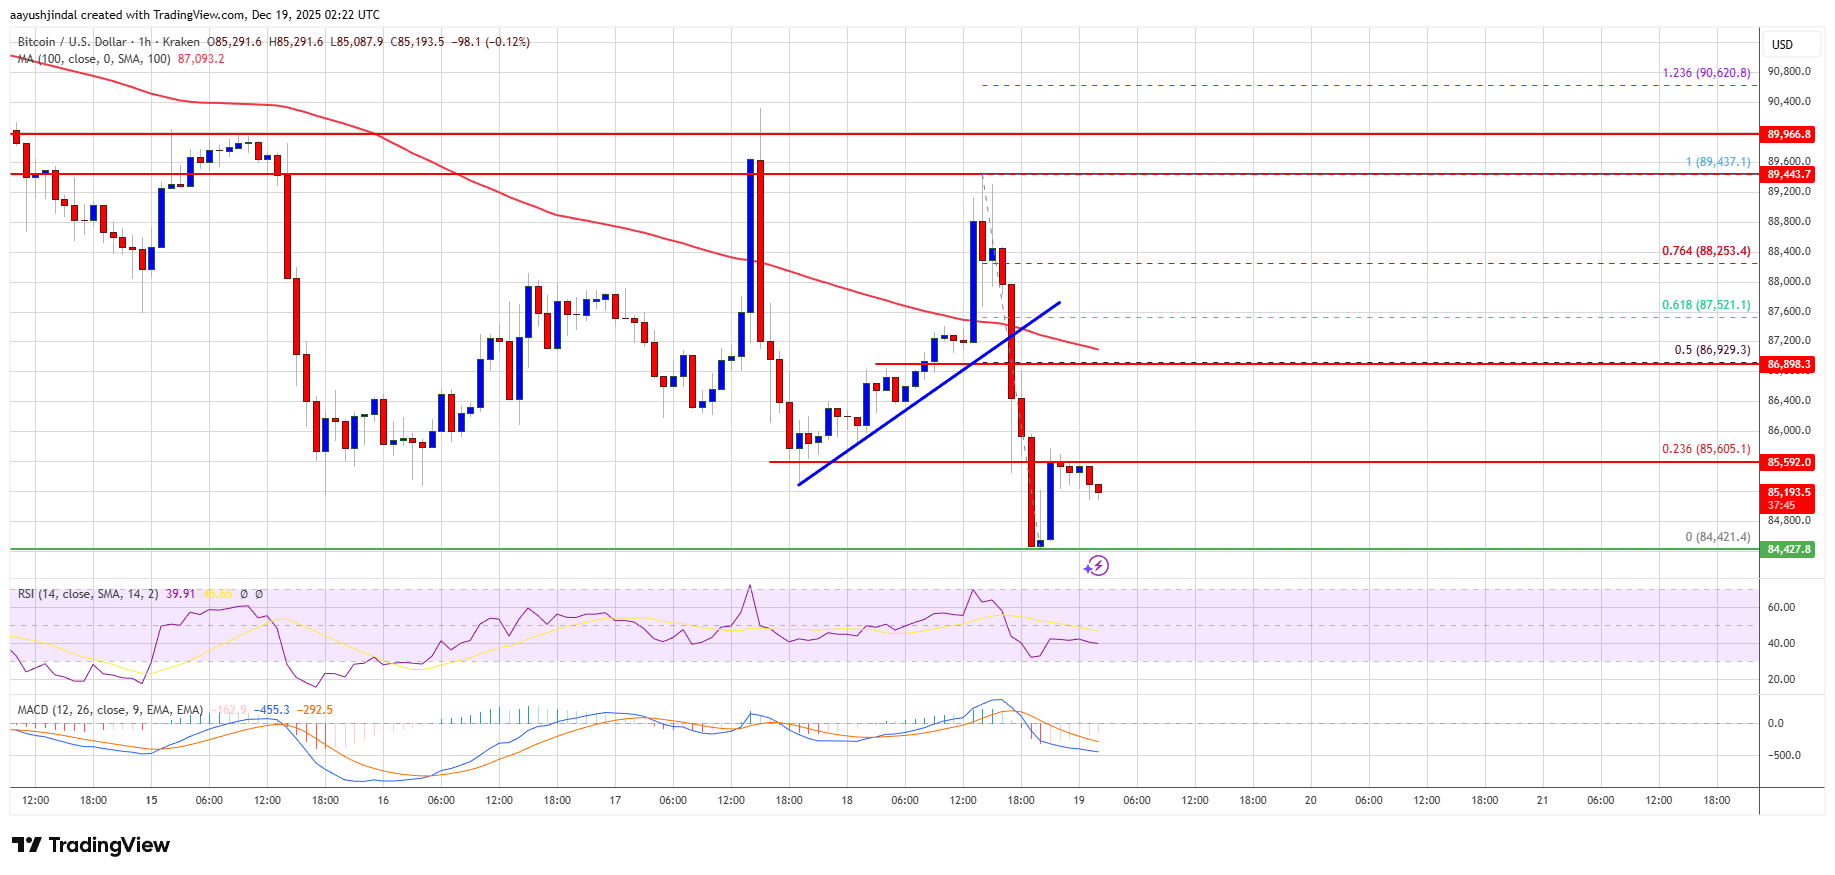
- Bitcoin started a fresh decline below the $86,500 zone.
- The price is trading below $86,500 and the 100 hourly Simple moving average.
- There was a break below a bullish trend line with support at $87,250 on the hourly chart of the BTC/USD pair (data feed from Kraken).
- The pair might continue to move down if it settles below the $85,000 zone.
Bitcoin price attempted a fresh recovery wave above $88,000 and $88,500. BTC tested the $89,500 resistance zone and reacted to the downside. There was a sharp decline below $88,000.
There was a break below a bullish trend line with support at $87,250 on the hourly chart of the BTC/USD pair. The price even spiked below the $85,000 support. However, the bulls were active near the $84,500 zone. A low was formed at $84,421 and the price is now consolidating losses below the 23.6% Fib retracement level of the downward move from the $89,437 swing high to the $84,421 low.
Bitcoin is now trading below $87,000 and the 100 hourly Simple moving average. If the bulls remain in action, the price could attempt more gains. Immediate resistance is near the $86,600 level. The first key resistance is near the $87,000 level and the 50% Fib retracement level of the downward move from the $89,437 swing high to the $84,421 low.
The next resistance could be $88,000. A close above the $88,000 resistance might send the price further higher. In the stated case, the price could rise and test the $88,800 resistance. Any more gains might send the price toward the $89,500 level. The next barrier for the bulls could be $90,000 and $90,500.
More Losses In BTC?If Bitcoin fails to rise above the $87,000 resistance zone, it could start another decline. Immediate support is near the $85,000 level. The first major support is near the $84,500 level.
The next support is now near the $83,200 zone. Any more losses might send the price toward the $82,500 support in the near term. The main support sits at $80,500, below which BTC might accelerate lower in the near term.
Technical indicators:
Hourly MACD – The MACD is now gaining pace in the bearish zone.
Hourly RSI (Relative Strength Index) – The RSI for BTC/USD is now below the 50 level.
Major Support Levels – $85,000, followed by $84,500.
Major Resistance Levels – $87,000 and $88,000.
Why this matters
This bitcoin story adds another data point to the current market tape and is useful when read alongside nearby source coverage.
Original source
Read on NewsBTCRelated market context

Mark Zuckerberg’s Meta AI Predicts Unbelievable Bitcoin Price by the End of 2026
Mark Zuckerberg’s Meta AI predicts and stacks 4 numbered catalysts behind its Bitcoin price prediction that puts $120,000 to $150,...

Leading Claude AI Fable 5 Predicts Stunning XRP Price by The End of 2026
Anthropic’s new Claude AI model, Fable 5, predicts XRP price for the entire second half around a single event that could be resolv...

XRP Price Prediction: SuperTrend Buy Signal Meets Shrinking Supply as $1.24 Breakout Comes Into Focus
After a fresh SuperTrend buy signal appeared on the 4-hour chart, analysts are watching whether the XRP price can extend its recen...

Bitcoin whales send 49,000 BTC to exchanges as $60K rebound shows signs of weakness
Bitcoin’s recovery above $60,000 is facing a fresh test from exchange-flow and derivatives data after large holders moved one of t...

Micron stock soars nearly 700% in a year as tokenized version trades on Ethereum via Ondo
Micron's stock surge and tokenization highlight the growing intersection of traditional finance and decentralized finance, impacti...

Bitcoin Price Eyes Recovery After END-OF-CYCLE STRC Shock, Bitwise CIO Says Strategy Will Be ‘Less Important’ Next BTC Cycle
While improving macroeconomic conditions have supported a modest Bitcoin price rebound, Bitwise Chief Investment Officer Matt Houg...