Bitcoin Price Rises Again—Are Bulls Charging Toward a New All-Time High?
Bitcoin price started a fresh increase above the $106,000 zone. BTC is now consolidating and might attempt to clear the $110,500 resistance. Bitcoin started a fresh upward move above the $107,000 zone. The price is tradi...
Archive context
Older archive item. Useful for background and entity history, but not a fresh market-moving signal.

Bitcoin price started a fresh increase above the $106,000 zone. BTC is now consolidating and might attempt to clear the $110,500 resistance.
- Bitcoin started a fresh upward move above the $107,000 zone.
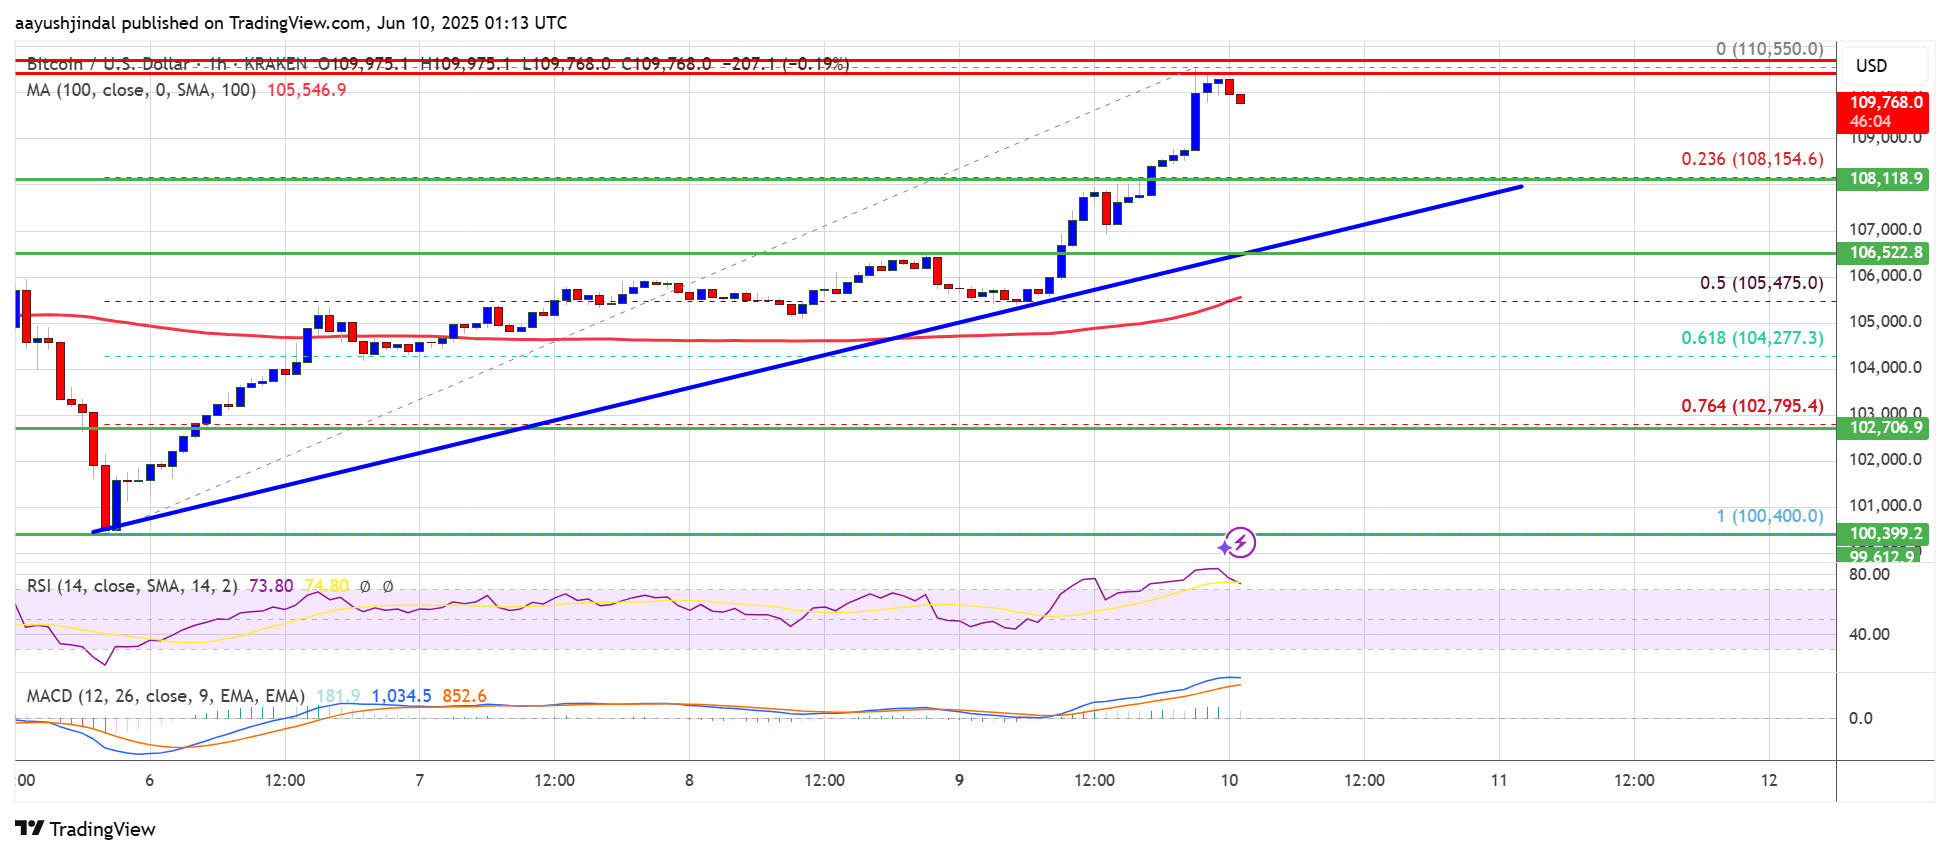
- The price is trading above $107,000 and the 100 hourly Simple moving average.
- There is a bullish trend line forming with support at $106,850 on the hourly chart of the BTC/USD pair (data feed from Kraken).
- The pair could start a fresh decline if it breaks the $105,000 support zone.
Bitcoin price started a fresh increase after it settled above the $103,500 support zone. BTC was able to surpass the $104,400 and $105,000 resistance levels.
The bulls even pumped the price above the $108,000 resistance. A high was formed at $110,550 and the price is now consolidating gains above the 23.6% Fib retracement level of the upward move from the $100,400 swing low to the $110,550 high.
Bitcoin is now trading above $108,000 and the 100 hourly Simple moving average. There is also a bullish trend line forming with support at $106,850 on the hourly chart of the BTC/USD pair.
On the upside, immediate resistance is near the $110,000 level. The first key resistance is near the $110,500 level. The next key resistance could be $112,500. A close above the $112,500 resistance might send the price further higher. In the stated case, the price could rise and test the $113,800 resistance level. Any more gains might send the price toward the $115,000 level.
Another Decline In BTC?If Bitcoin fails to rise above the $110,500 resistance zone, it could start another decline. Immediate support is near the $108,200 level. The first major support is near the $106,500 level and the trend line.
The next support is now near the $105,500 zone and the 50% Fib retracement level of the upward move from the $100,400 swing low to the $110,550 high. Any more losses might send the price toward the $103,500 support in the near term. The main support sits at $102,000, below which BTC might gain bearish momentum.
Technical indicators:
Hourly MACD – The MACD is now gaining pace in the bullish zone.
Hourly RSI (Relative Strength Index) – The RSI for BTC/USD is now above the 50 level.
Major Support Levels – $108,000, followed by $106,500.
Major Resistance Levels – $110,500 and $112,500.
Why this matters
This bitcoin story adds another data point to the current market tape and is useful when read alongside nearby source coverage.
Original source
Read on NewsBTCRelated market context

Bitcoin (BTC) Price Prediction: BTC Holds $63K Support—Can Rising Active Addresses Offset Bearish Technical Signals?
Although the BTC price has remained near a key support zone, recent chart signals and Strategy’s sale of a portion of its Bitcoin...

Nigel Farage faces probe following crypto aide’s secret support, report
Nigel Farage has been accused of breaking parliamentary rules after convicted criminal and crypto gambler George Cottrell apparent...

JPMorgan’s JLTXX tokenized money market fund surges 250% in a month to nearly $700M
JPMorgan's rapid growth in tokenized funds highlights the increasing integration of traditional finance with blockchain, impacting...

Strategy Sells 3,588 Bitcoin to Fund Dividends as Saylor’s Treasury Model Meets Its First Real Test
Strategy (MSTR), the Michael Saylor–led company that turned corporate bitcoin accumulation into a Wall Street phenomenon, disclose...

Coinbase World Cup error shows prediction markets still have a proof problem
A reported Coinbase announcement about a World Cup result, likely using AI, created a problem bigger than a flawed alert. It showe...

Jude Bellingham’s emotional World Cup moment highlights why sports and crypto betting markets are booming
The rise of crypto betting markets reflects a shift towards decentralized, global, and instant engagement in sports and other majo...