Bitcoin Price Slide: Extends Losses Amid Increased Selling Pressure
Bitcoin price extended its losses and traded below the $65,000 level. BTC is showing bearish signs and might extend losses below the $64,600 level. Bitcoin remained in a bearish zone and traded below $65,000. The price i...
Archive context
Older archive item. Useful for background and entity history, but not a fresh market-moving signal.

Bitcoin price extended its losses and traded below the $65,000 level. BTC is showing bearish signs and might extend losses below the $64,600 level.
- Bitcoin remained in a bearish zone and traded below $65,000.
- The price is trading below $66,000 and the 100 hourly Simple moving average.
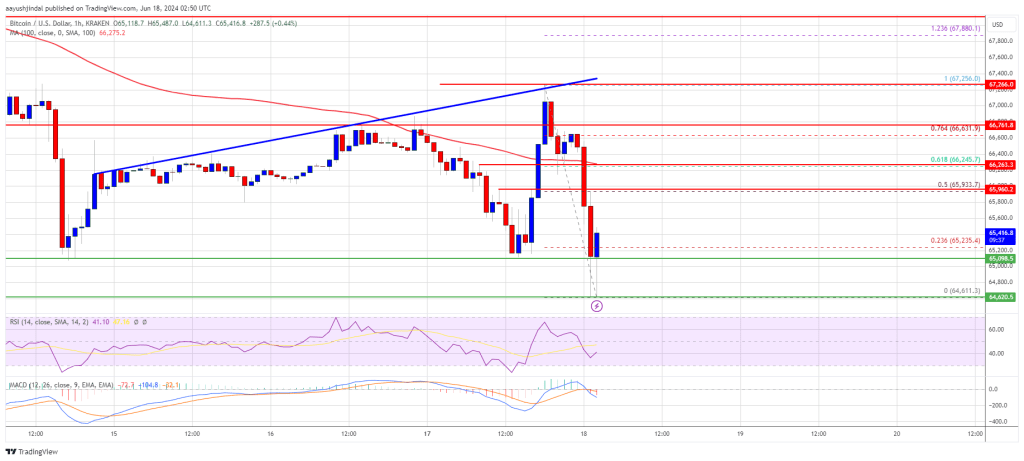
- There is a connecting trend line forming with resistance at $67,500 on the hourly chart of the BTC/USD pair (data feed from Kraken).
- The pair could continue to move down and even trade below the $64,500 support zone.
Bitcoin price struggled to recover above the $66,500 resistance zone. BTC remained in a bearish zone and started a fresh decline from the $67,256 high. There was a move below the $66,500 level.
There was a clear move below the $65,500 and $65,000 support levels. Finally, the price tested $64,600. A low was formed at $64,611 and the price is now consolidating losses. There was a minor increase above the $65,000 level. The price climbed above the 23.6% Fib retracement level of the downward move from the $67,256 swing high to the $64,611 low.
Bitcoin is now trading below $66,000 and the 100 hourly Simple moving average. There is also a connecting trend line forming with resistance at $67,500 on the hourly chart of the BTC/USD pair.
On the upside, the price is facing resistance near the $66,000 level or the 50% Fib retracement level of the downward move from the $67,256 swing high to the $64,611 low. The first major resistance could be $66,250. The next key resistance could be $66,500.
A clear move above the $66,500 resistance might start a decent increase and send the price higher. In the stated case, the price could rise and test the $67,500 resistance. Any more gains might send BTC toward the $68,500 resistance in the near term.
More Losses In BTC?If Bitcoin fails to climb above the $66,000 resistance zone, it could continue to move down. Immediate support on the downside is near the $65,000 level.
The first major support is $64,600. The next support is now forming near $64,500. Any more losses might send the price toward the $63,200 support zone in the near term.
Technical indicators:
Hourly MACD – The MACD is now gaining pace in the bearish zone.
Hourly RSI (Relative Strength Index) – The RSI for BTC/USD is now below the 50 level.
Major Support Levels – $65,000, followed by $64,500.
Major Resistance Levels – $66,000, and $66,500.
Why this matters
This bitcoin story adds another data point to the current market tape and is useful when read alongside nearby source coverage.
Original source
Read on NewsBTCRelated market context

Bitcoin (BTC) Price Prediction: BTC Holds $63K Support—Can Rising Active Addresses Offset Bearish Technical Signals?
Although the BTC price has remained near a key support zone, recent chart signals and Strategy’s sale of a portion of its Bitcoin...

Sui DeFi TVL Breaks $1 Billion As Move-Based Chains Fight For Liquidity
Sui has crossed the $1 billion total value locked mark on DeFiLlama, giving the Move-based network a clearer claim to serious DeFi...

Bitcoin price rebounds to $63K as leverage returns creating short term volatility risk
Bitcoin's rebound has cleared the first test: price recovered. The harder one starts now: proving buyers remain after the squeeze....

New SummerFi DeFi exploit shows AI automation now sits above smart contract risk
Summer.fi's automated vault incident has put delegated DeFi yield back under pressure after Blockaid said on July 6 that its explo...

Bitcoin dominance hits one-month low as altcoin winners start breaking away
Bitcoin's dominance dropped to a one-month low of 54%, down from 58.12%, according to CoinGecko's dominance table. Over the same s...

Coinbase World Cup error shows prediction markets still have a proof problem
A reported Coinbase announcement about a World Cup result, likely using AI, created a problem bigger than a flawed alert. It showe...