Bitcoin Price Spikes To $19K, Why BTC Could Correct Lower In Short Term
Bitcoin price climbed further higher above $18,500. BTC tested the $19,000 resistance zone and is currently consolidating gains. Bitcoin climbed further higher above the $18,000 and $18,500 resistance levels. The price i...
Archive context
Older archive item. Useful for background and entity history, but not a fresh market-moving signal.

Bitcoin price climbed further higher above $18,500. BTC tested the $19,000 resistance zone and is currently consolidating gains.
- Bitcoin climbed further higher above the $18,000 and $18,500 resistance levels.
- The price is trading above $18,200 and the 100 hourly simple moving average.
- There is a connecting bullish trend line forming with support near $18,600 on the hourly chart of the BTC/USD pair (data feed from Kraken).
- The pair could correct lower towards the $18,500 and $18,350 support levels.
Bitcoin price remained well bid above the $18,000 zone. BTC formed another bullish breakout and was able to surge above the $18,500 resistance zone, unlike ethereum.
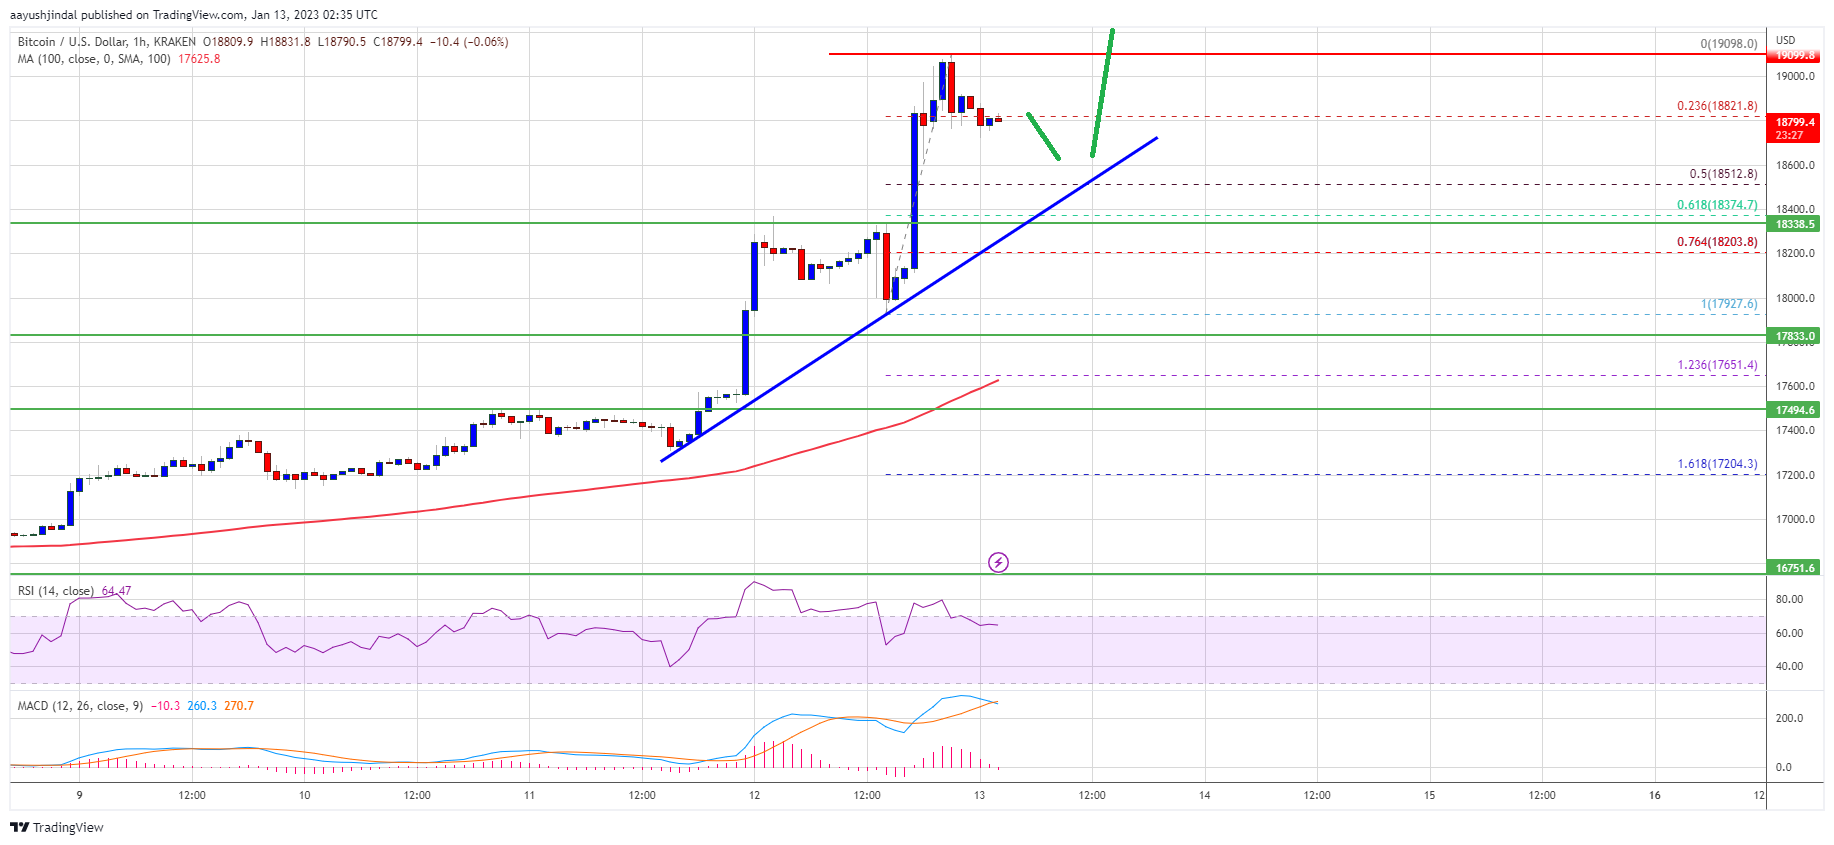
The price cleared the $18,800 resistance zone and even spiked above the $19,000 level. A high is formed near $19,098 and the price is now consolidating gains. There was a minor decline below the $18,900 level. The price declined below the 23.6% Fib retracement level of the upward move from the $17,927 swing low to $19,098 high.
Bitcoin price is trading above $18,200 and the 100 hourly simple moving average. There is also a connecting bullish trend line forming with support near $18,600 on the hourly chart of the BTC/USD pair.
Source: BTCUSD on TradingView.com
On the upside, an immediate resistance is near the $19,000 level. The next major resistance is near the $19,200 zone, above which the price might start another steady increase. In the stated case, the price may perhaps rise towards the $19,500 level. Any more gains might send btc price towards the $20,000 level.
Downside Correction in BTC?If bitcoin price fails to clear the $19,000 resistance, it could start a downside correction. An immediate support on the downside is near the $18,650 level.
The next major support is near the $18,500 level and the trend line. It is near the 50% Fib retracement level of the upward move from the $17,927 swing low to $19,098 high. The main support is now forming near the $17,800 level, below which the price might retest $17,000.
Technical indicators:
Hourly MACD – The MACD is now losing pace in the bullish zone.
Hourly RSI (Relative Strength Index) – The RSI for BTC/USD is now above the 50 level.
Major Support Levels – $18,650, followed by $18,500.
Major Resistance Levels – $19,000, $19,200 and $20,000.
Why this matters
This bitcoin story adds another data point to the current market tape and is useful when read alongside nearby source coverage.
Original source
Read on NewsBTCRelated market context

Ethereum (ETH) Price Prediction: ETH Eyes $2,100 as ETF Inflows Return and Whale Demand Builds
Ethereum price is trading near $1,785 after a modest 24-hour recovery, but the market is now watching whether fresh inflows and wh...

XRP Price Prediction: Key Metrics Point to a Crash
XRP prediction chatter is heating up even as the price slips, which is usually when markets like to play tricks. XRP trades at aro...

Ethereum Price Prediction: Robinhood Chain Leads Ethereum’s Biggest User Onboarding Wave
Price prediction debates are heating up as Ethereum trades at $1,790 and is slipping in trading volume. Still, Robinhood Chain kee...

XRP Price Prediction: Bears Eye $1 Support as Whale Activity Suddenly Collapses
While Ripple XRP is still holding above the psychologically important $1 level, analysts are closely monitoring whether buyers can...

Bitcoin Price Prediction: Strategy Has a New BTC Approach
Bitcoin price is trading at $62,900, as we debate whether this pause is simply a reset or something more serious, with bearish pre...

June CPI Beat Sparks Bitcoin Surge, but the Fed’s September Hike Looms
June CPI fell a seasonally adjusted 0.4% month-over-month, the steepest monthly drop since April 2020, pulling the annual inflatio...