Bitcoin Price Struggles: Can Bulls Step In to Save the Week?
Bitcoin price declined and retested the $55,600 support zone. BTC is now struggling and might face hurdles near the $57,000 resistance level. Bitcoin is struggling to recover above the $57,750 zone. The price is trading...
Archive context
Older archive item. Useful for background and entity history, but not a fresh market-moving signal.

Bitcoin price declined and retested the $55,600 support zone. BTC is now struggling and might face hurdles near the $57,000 resistance level.
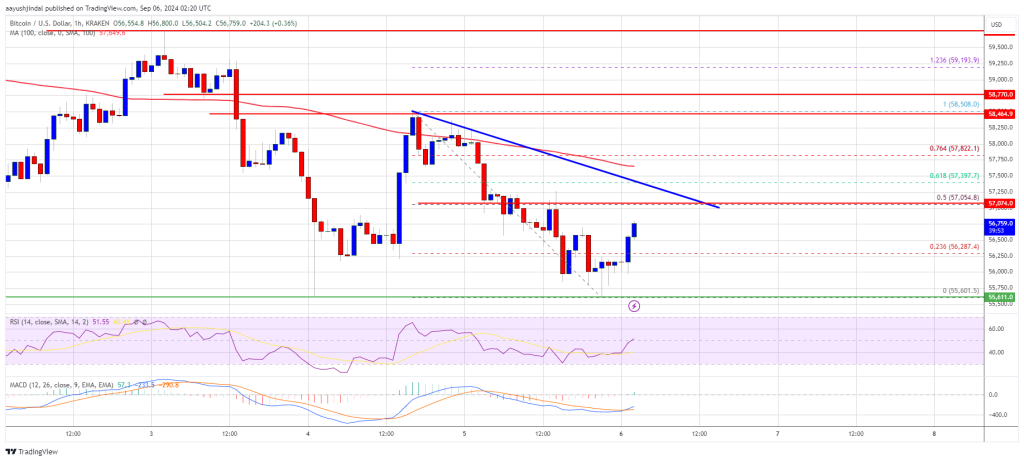
- Bitcoin is struggling to recover above the $57,750 zone.
- The price is trading below $57,200 and the 100 hourly Simple moving average.
- There is a connecting bearish trend line forming with resistance at $57,050 on the hourly chart of the BTC/USD pair (data feed from Kraken).
- The pair could struggle to recover above the $57,000 or $57,750 resistance levels in the near term.
Bitcoin price attempted a recovery wave above the $57,500 level. However, the bears were active near the $58,500 resistance level. A high was formed at $58,508 and the price started another decline.
It retested the $55,600 support zone. A low was formed at $55,601 and the price recently started a recovery wave. There was a move above the $56,000 and $56,200 resistance levels. It cleared the 23.6% Fib retracement level of the downward move from the $58,508 swing high to the $55,601 low.
Bitcoin is now trading below $57,200 and the 100 hourly Simple moving average. On the upside, the price could face resistance near the $57,000 level. There is also a connecting bearish trend line forming with resistance at $57,050 on the hourly chart of the BTC/USD pair.
The trend line is close to the 50% Fib retracement level of the downward move from the $58,508 swing high to the $55,601 low. The first key resistance is near the $57,750 level. A clear move above the $57,750 resistance might send the price further higher in the coming sessions.
The next key resistance could be $58,500. A close above the $58,500 resistance might spark more upsides. In the stated case, the price could rise and test the $60,000 resistance.
Another Decline In BTC?If Bitcoin fails to rise above the $57,750 resistance zone, it could start another decline. Immediate support on the downside is near the $56,000 level.
The first major support is $55,600. The next support is now near the $55,000 zone. Any more losses might send the price toward the $53,500 support in the near term.
Technical indicators:
Hourly MACD – The MACD is now losing pace in the bearish zone.
Hourly RSI (Relative Strength Index) – The RSI for BTC/USD is now near the 50 level.
Major Support Levels – $56,000, followed by $55,600.
Major Resistance Levels – $57,050, and $57,750.
Why this matters
This bitcoin story adds another data point to the current market tape and is useful when read alongside nearby source coverage.
Original source
Read on NewsBTCRelated market context

Ethereum (ETH) Price Prediction: ETH Holds Near $1,780 as Bulls Eye $1,860–$1,950, but $1,609 Remains Key Invalidation
Ethereum price is trading near $1,779 after a mixed 24-hour session, according to Brave New Coin data. ETH is down around 0.76% on...

Solana Price Prediction: SOL Holds Near $81 as Breakout Setup Points to $87, but Whale Flows Keep Risk Active
Solana price is back in focus after a sharp recovery pushed SOL towards the $81 area. The move has improved short-term momentum, e...

Hyperliquid (HYPE) Price Prediction: Symmetrical Triangle Breakout Puts $77 Target Back in Focus
The breakout comes after several sessions of price compression, with HYPE continuing to trade within a broader technical structure...

Ether leads crypto's hold above key levels as bitcoin steadies over $63,000
A stalling rebound in AI and chip stocks and a stronger dollar kept the mood cautious as the second half gets underway.

XRP vs Bitcoin: Investor Says RLUSD Growth and Regulatory Clarity Could Shift Crypto’s Balance of Power
While the claim remains highly ambitious given Bitcoin’s commanding lead in market capitalization, the discussion highlights broad...

Bitcoin whales send 49,000 BTC to exchanges as $60K rebound shows signs of weakness
Bitcoin’s recovery above $60,000 is facing a fresh test from exchange-flow and derivatives data after large holders moved one of t...