Bitcoin Price Surges Toward $110K — Will It Finally Stick the Landing?
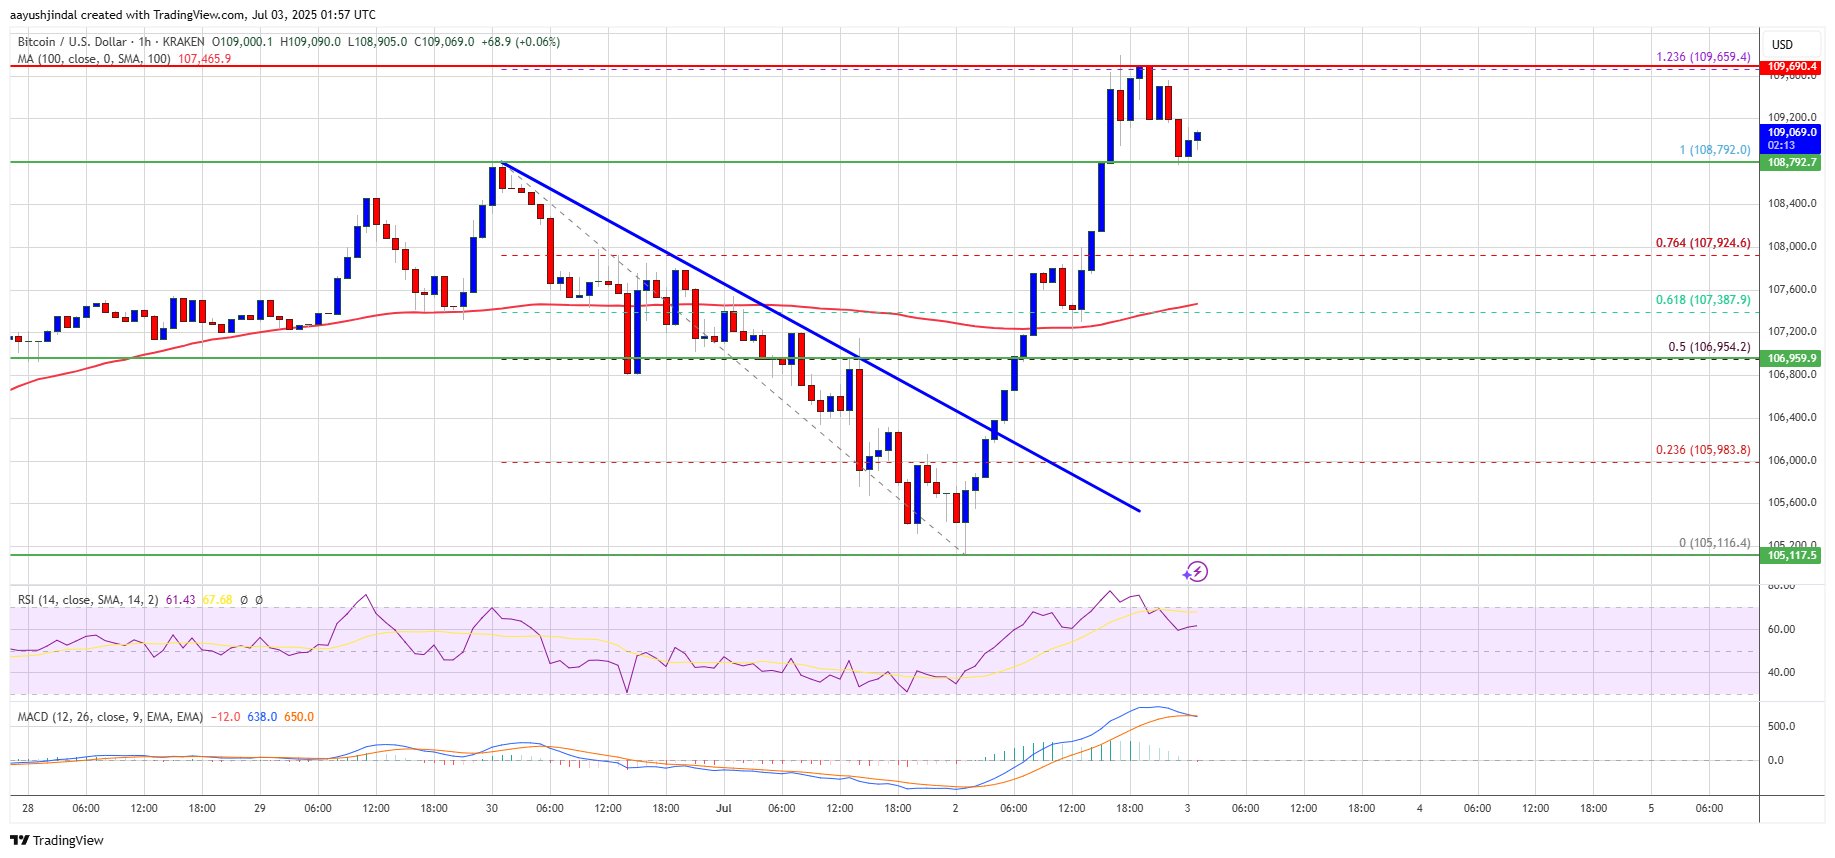
Bitcoin price started a fresh increase from the $105,200 zone. BTC is now consolidating and might struggle to continue higher above the $110,000 resistance. Bitcoin started a fresh increase above the $108,000 zone. The p...
Archive context
Older archive item. Useful for background and entity history, but not a fresh market-moving signal.

Bitcoin price started a fresh increase from the $105,200 zone. BTC is now consolidating and might struggle to continue higher above the $110,000 resistance.
- Bitcoin started a fresh increase above the $108,000 zone.
- The price is trading above $107,500 and the 100 hourly Simple moving average.
- There was a break above a bearish trend line with resistance at $106,300 on the hourly chart of the BTC/USD pair (data feed from Kraken).
- The pair could start a fresh increase if it stays above the $107,000 zone.
Bitcoin price remained supported above the $105,000 level and started a fresh increase. BTC cleared many hurdles near $106,200 to start a decent increase.
There was a break above a bearish trend line with resistance at $106,300 on the hourly chart of the BTC/USD pair. The pair pumped above the $107,500 resistance level. It cleared the 76.4% Fib retracement level of the downward move from the $108,792 swing high to the $105,116 low.
Finally, the price surged toward the $110,000 level. It tested the 1.236 Fib extension level of the downward move from the $108,792 swing high to the $105,116 low.
Bitcoin is now trading above $108,000 and the 100 hourly Simple moving average. On the upside, immediate resistance is near the $109,400 level. The first key resistance is near the $110,000 level. A close above the $110,000 resistance might send the price further higher. In the stated case, the price could rise and test the $112,000 resistance level. Any more gains might send the price toward the $113,200 level.
Downside Correction In BTC?If Bitcoin fails to rise above the $110,000 resistance zone, it could start another decline. Immediate support is near the $108,750 level. The first major support is near the $108,000 level.
The next support is now near the $107,200 zone. Any more losses might send the price toward the $106,500 support in the near term. The main support sits at $105,000, below which BTC might continue to move down.
Technical indicators:
Hourly MACD – The MACD is now losing pace in the bullish zone.
Hourly RSI (Relative Strength Index) – The RSI for BTC/USD is now above the 50 level.
Major Support Levels – $108,000, followed by $107,200.
Major Resistance Levels – $110,000 and $112,000.
Why this matters
This bitcoin story adds another data point to the current market tape and is useful when read alongside nearby source coverage.
Original source
Read on NewsBTCRelated market context

Bitcoin (BTC) Price Prediction: BTC Holds $63K Support—Can Rising Active Addresses Offset Bearish Technical Signals?
Although the BTC price has remained near a key support zone, recent chart signals and Strategy’s sale of a portion of its Bitcoin...

Bitcoin Price Prediction: Peter Brandt Might Dump BTC for Gold
Bitcoin is facing a test, and its price prediction is not helping. So far in 2026, BTC has fallen about 28%, while gold is down ju...

XRP Price Prediction: Volume and ETF Inflow Send Ripple Token Higher
XRP price pushed above the $1.14 resistance area after buyers stepped in with heavy volume and bullish prediction. The token climb...

Bitcoin miner bottom signal now depends on who survives weak mining profits
A Bitcoin miner-stress signal circulating on X has fallen into a zone analysts associate with severe miner pressure, putting a fam...

IRGC fires missiles at commercial ships near Strait of Hormuz, rattling oil and crypto markets
The escalating tensions near the Strait of Hormuz could lead to increased regulatory scrutiny on cryptocurrency transactions and i...

Coinbase World Cup error shows prediction markets still have a proof problem
A reported Coinbase announcement about a World Cup result, likely using AI, created a problem bigger than a flawed alert. It showe...