Bitcoin Price Tests Support: Will It Bounce Back Stronger?
Bitcoin price failed to clear the $61,500 resistance zone. BTC is now retesting the $58,000 support and might attempt a fresh increase. Bitcoin started a fresh decline from the $61,500 resistance zone. The price is tradi...
Archive context
Older archive item. Useful for background and entity history, but not a fresh market-moving signal.

Bitcoin price failed to clear the $61,500 resistance zone. BTC is now retesting the $58,000 support and might attempt a fresh increase.
- Bitcoin started a fresh decline from the $61,500 resistance zone.
- The price is trading below $60,000 and the 100 hourly Simple moving average.
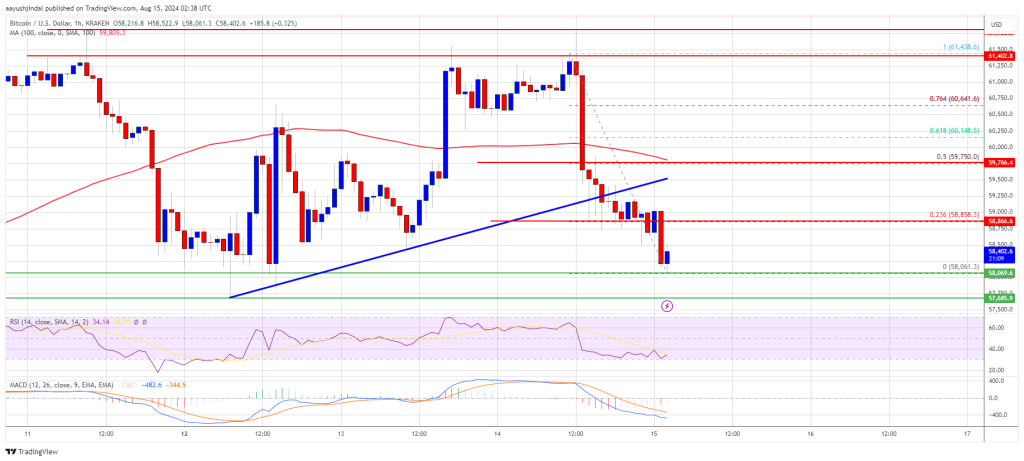
- There was a break below a key bullish trend line with support at $59,250 on the hourly chart of the BTC/USD pair (data feed from Kraken).
- The pair might attempt a fresh increase if it stays above the $58,000 zone.
Bitcoin price failed to settle above the $61,500 resistance zone. BTC formed a short-term top and started a fresh decline below the $60,500 level. There was a move below the $60,000 and $59,000 levels.
Besides, there was a break below a key bullish trend line with support at $59,250 on the hourly chart of the BTC/USD pair. The pair retested the $58,000 support zone. A low is formed at $58,061 and the price is now consolidating losses.
Bitcoin price is now trading below $60,000 and the 100 hourly Simple moving average. On the upside, the price could face resistance near the $58,800 level. It is close to the 23.6% Fib retracement level of the downward move from the $61,438 swing high to the $58,061 low.
The first key resistance is near the $59,500 level or the 50% Fib retracement level of the downward move from the $61,438 swing high to the $58,061 low A clear move above the $59,500 resistance might send the price further higher in the coming sessions. The next key resistance could be $60,000.
The next major hurdle sits at $61,500. A close above the $61,500 resistance might spark more upsides. In the stated case, the price could rise and test the $63,500 resistance.
More Losses In BTC?If Bitcoin fails to rise above the $58,800 resistance zone, it could continue to move down. Immediate support on the downside is near the $58,000 level.
The first major support is $57,650. The next support is now near the $56,500 zone. Any more losses might send the price toward the $55,500 support zone or even $55,000 in the near term.
Technical indicators:
Hourly MACD – The MACD is now gaining pace in the bearish zone.
Hourly RSI (Relative Strength Index) – The RSI for BTC/USD is now below the 50 level.
Major Support Levels – $58,000, followed by $57,650.
Major Resistance Levels – $58,800, and $59,500.
Why this matters
This bitcoin story adds another data point to the current market tape and is useful when read alongside nearby source coverage.
Original source
Read on NewsBTCRelated market context

Ethereum (ETH) Price Prediction: ETH Holds Near $1,780 as Bulls Eye $1,860–$1,950, but $1,609 Remains Key Invalidation
Ethereum price is trading near $1,779 after a mixed 24-hour session, according to Brave New Coin data. ETH is down around 0.76% on...

Solana Price Prediction: SOL Holds Near $81 as Breakout Setup Points to $87, but Whale Flows Keep Risk Active
Solana price is back in focus after a sharp recovery pushed SOL towards the $81 area. The move has improved short-term momentum, e...

Bitcoin Price Prediction: Peter Brandt Might Dump BTC for Gold
Bitcoin is facing a test, and its price prediction is not helping. So far in 2026, BTC has fallen about 28%, while gold is down ju...

XRP Price Prediction: Volume and ETF Inflow Send Ripple Token Higher
XRP price pushed above the $1.14 resistance area after buyers stepped in with heavy volume and bullish prediction. The token climb...

Dormant $1.9M Bitcoin tied to New York lawsuit moves after nearly 15 years
A Bitcoin address dormant for nearly 15 years moved $1.9 million in BTC as a New York lawsuit seeks ownership of thousands of inac...

Hyperliquid (HYPE) Price Prediction: Symmetrical Triangle Breakout Puts $77 Target Back in Focus
The breakout comes after several sessions of price compression, with HYPE continuing to trade within a broader technical structure...