Bitcoin Price Trims Gains, But Uptrend Still Holds Strong
Bitcoin price started a strong increase above the $70,500 zone. BTC is consolidating gains and might aim for more gains above the $71,650 zone. Bitcoin gained pace for a move above the $70,500 and $71,500 levels. The pri...

Bitcoin price started a strong increase above the $70,500 zone. BTC is consolidating gains and might aim for more gains above the $71,650 zone.
- Bitcoin gained pace for a move above the $70,500 and $71,500 levels.
- The price is trading above $70,200 and the 100 hourly simple moving average.
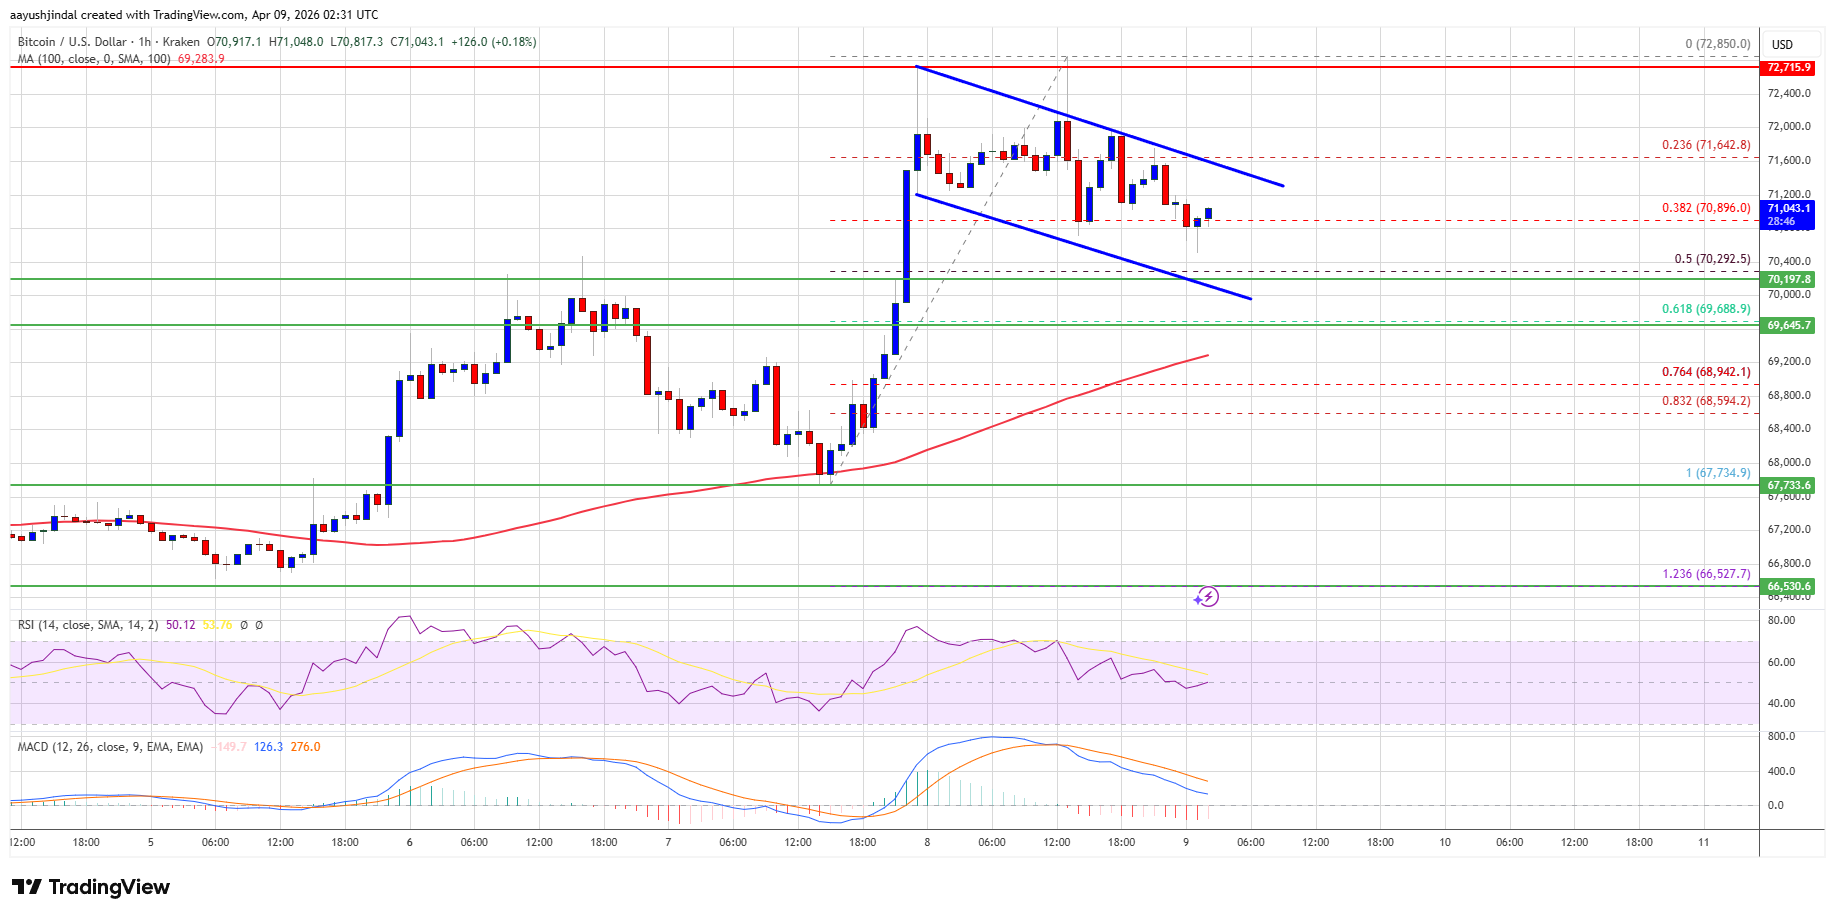
- There is a new bullish flag pattern forming with resistance at $71,650 on the hourly chart of the BTC/USD pair (data feed from Kraken).
- The pair might extend gains if it stays above the $70,250 and $69,500 levels.
Bitcoin price managed to climb higher above the $69,500 resistance zone. BTC gained pace for a move above the $70,500 and $71,200 levels.
The pair even rallied above the $72,200 level. A high was formed at $72,728, and the price started a downside correction. There was a move below the 23.6% Fib retracement level of the upward move from the $67,735 swing low to the $72,728 high.
However, the bulls were active above $70,000. Bitcoin is now trading above $70,500 and the 100 hourly simple moving average. If the price remains stable above $70,000, it could attempt a fresh increase. Immediate resistance is near the $71,650 level. There is also a new bullish flag pattern forming with resistance at $71,650 on the hourly chart of the BTC/USD pair.
The first key resistance is near the $72,000 level. A close above the $72,000 resistance might send the price further higher. In the stated case, the price could rise and test the $72,800 resistance. Any more gains might send the price toward the $73,500 level. The next barrier for the bulls could be $74,000.
More Losses In BTC?If Bitcoin fails to rise above the $71,650 resistance zone, it could start another decline. Immediate support is near the $70,300 level or the 50% Fib retracement level of the upward move from the $67,735 swing low to the $72,728 high.
The first major support is near the $70,000 level. The next support is now near the $69,650 zone. Any more losses might send the price toward the $69,000 support in the near term. The main support now sits at $68,800, below which BTC might struggle to recover in the near term.
Technical indicators:
Hourly MACD – The MACD is now losing pace in the bearish zone.
Hourly RSI (Relative Strength Index) – The RSI for BTC/USD is now near the 50 level.
Major Support Levels – $70,300, followed by $70,000.
Major Resistance Levels – $71,650 and $72,800.
Original source
Read on NewsBTCRelated market context

Kraken Adds USDCx Support On Canton As Institutional Stablecoin Rails Expand
TL;DR Kraken says it now supports USDCx deposits and withdrawals on the Canton Network. USDCx is described as a Canton-native stab...

XRP Price Prediction: Japan XRP ETF Listing is Getting Closer
Japan just handed XRP bulls a major regulatory tailwind. XRP price is retesting a congestion zone, and the prediction could turn b...

Kraken Becomes Official Crypto Exchange Supporter Of FIFA World Cup 2026
TL;DR Kraken says it has become the Official Crypto Exchange Supporter of the FIFA World Cup 2026. The tournament expands to 48 te...

XRP Price Prediction: Japan Regulates Crypto like Stocks, XRP to Benefit First
Japan just rewrote the rules. XRP price is battling below resistance at $1.10, but it’s prediction is getting bullish as Japan’s p...

Ripple chases AI’s machine economy as XRPL stablecoins near $1 billion
Stablecoin liquidity on the XRP Ledger (XRPL) has nearly doubled over the past month, putting the network within reach of a $1 bil...

Paraguay faces United States in 2026 World Cup opener as Kraken becomes FIFA’s official crypto exchange supporter
The integration of crypto in global sports events like the World Cup could accelerate digital currency adoption and reshape fan en...