Bitcoin Price Trims Gains: Is the Rally Losing Steam?
Bitcoin price started a downside correction from the $62,700 resistance zone. BTC is now consolidating near $58,500 and struggling to recover. Bitcoin started a decent downward move below the $61,500 and $60,000 levels....
Archive context
Older archive item. Useful for background and entity history, but not a fresh market-moving signal.

Bitcoin price started a downside correction from the $62,700 resistance zone. BTC is now consolidating near $58,500 and struggling to recover.
- Bitcoin started a decent downward move below the $61,500 and $60,000 levels.
- The price is trading below $60,000 and the 100 hourly Simple moving average.
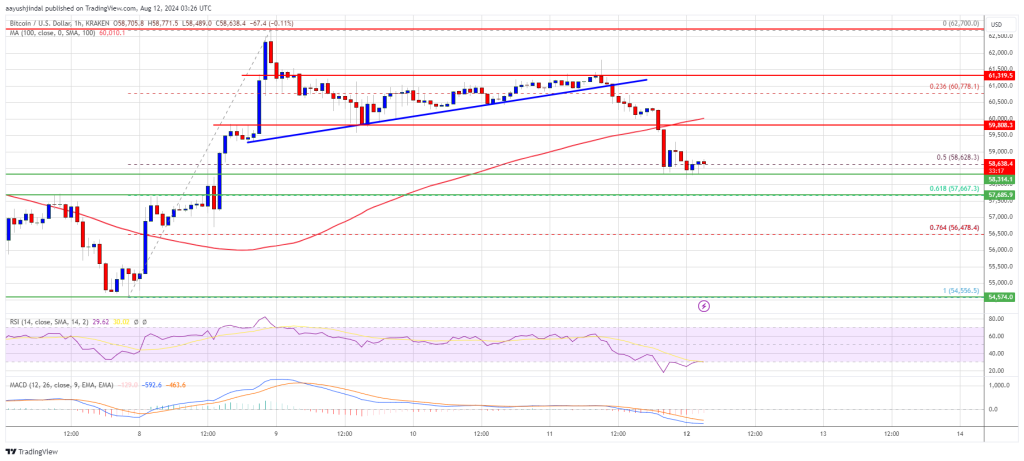
- There was a break below a key bullish trend line with support at $61,000 on the hourly chart of the BTC/USD pair (data feed from Kraken).
- The pair might decline further if it trades below the $58,500 support zone.
Bitcoin price started a downside correction after it failed to stay above $62,500. BTC declined below the $61,500 and $60,000 levels to move into a short-term bearish zone.
There was a break below a key bullish trend line with support at $61,000 on the hourly chart of the BTC/USD pair. The pair even dipped below the 50% Fib retracement level of the upward move from the $54,556 swing low to the $62,700 high.
Bitcoin price is now trading below $60,000 and the 100 hourly Simple moving average. The bulls are protecting the $58,500 support zone. The price is stable above the 61.8% Fib retracement level of the upward move from the $54,556 swing low to the $62,700 high.
On the upside, the price could face resistance near the $59,500 level. The first key resistance is near the $60,000 level. A clear move above the $60,000 resistance might send the price further higher in the coming sessions. The next key resistance could be $61,200.
The next major hurdle sits at $62,500. A close above the $62,500 resistance might spark bullish moves. In the stated case, the price could rise and test the $65,000 resistance.
More Downsides In BTC?If Bitcoin fails to rise above the $60,000 resistance zone, it could continue to move down. Immediate support on the downside is near the $58,500 level.
The first major support is $57,650. The next support is now near the $57,250 zone. Any more losses might send the price toward the $55,500 support zone or even $55,000 in the near term.
Technical indicators:
Hourly MACD – The MACD is now gaining pace in the bearish zone.
Hourly RSI (Relative Strength Index) – The RSI for BTC/USD is now below the 50 level.
Major Support Levels – $58,500, followed by $57,250.
Major Resistance Levels – $59,500, and $60,000.
Why this matters
This bitcoin story adds another data point to the current market tape and is useful when read alongside nearby source coverage.
Original source
Read on NewsBTCRelated market context

Ethereum (ETH) Price Prediction: ETH Holds Near $1,780 as Bulls Eye $1,860–$1,950, but $1,609 Remains Key Invalidation
Ethereum price is trading near $1,779 after a mixed 24-hour session, according to Brave New Coin data. ETH is down around 0.76% on...

Solana Price Prediction: SOL Holds Near $81 as Breakout Setup Points to $87, but Whale Flows Keep Risk Active
Solana price is back in focus after a sharp recovery pushed SOL towards the $81 area. The move has improved short-term momentum, e...

Bitcoin Price Prediction: Peter Brandt Might Dump BTC for Gold
Bitcoin is facing a test, and its price prediction is not helping. So far in 2026, BTC has fallen about 28%, while gold is down ju...

XRP Price Prediction: Volume and ETF Inflow Send Ripple Token Higher
XRP price pushed above the $1.14 resistance area after buyers stepped in with heavy volume and bullish prediction. The token climb...

Ether leads crypto's hold above key levels as bitcoin steadies over $63,000
A stalling rebound in AI and chip stocks and a stronger dollar kept the mood cautious as the second half gets underway.

Hyperliquid (HYPE) Price Prediction: Symmetrical Triangle Breakout Puts $77 Target Back in Focus
The breakout comes after several sessions of price compression, with HYPE continuing to trade within a broader technical structure...