Bitcoin Rejection Sparks Caution: Is The Rally Losing Steam?
Bitcoin’s recent rejection near key resistance has raised fresh concerns about the strength of its ongoing rally. After a steady climb, signs of selling pressure are beginning to emerge, hinting that bullish momentum may...
Archive context
Older archive item. Useful for background and entity history, but not a fresh market-moving signal.

Bitcoin’s recent rejection near key resistance has raised fresh concerns about the strength of its ongoing rally. After a steady climb, signs of selling pressure are beginning to emerge, hinting that bullish momentum may be weakening. With price now hovering around critical support zones, the next move could determine whether the uptrend regains traction or starts to lose steam.
2–618 Pattern Triggers: BTC Rejected At $78,000In a market update, analyst Kamile Uray revealed that the long-anticipated 2-618 pattern for Bitcoin has officially activated. After the price approached the $78,037 mark, significant selling pressure stalled the upward momentum. This reaction at the local peak confirms that the market is currently responding to technical overhead, initiating a corrective phase.
The immediate outlook suggests the current decline could extend down to the $73,762 level, which serves as a critical decision point for the asset. If Bitcoin manages to hold this floor, the possibility of a renewed bullish push remains on the table.
Should the price slip below the $73,762 bottom, the next major target is $70,165, which aligns with the 0.618 Fibonacci support of the most recent upward wave. A successful defense of this area would likely spark another upward move. Conversely, if bulls want to reclaim full control, they must achieve a close above $79,555. Such a move would establish the first higher high on the 4-hour chart relative to the recent downturn, signaling a continuation of the macro uptrend toward the $98,000 and $107,000–$109,000 range.
In the event of a more severe retracement, secondary supports are identified at $65,666, $63,823, $62,433, and $60,000. The stakes are particularly high at this lower limit; a daily close below $60,000 would be a highly bearish signal, potentially marking the beginning of a more substantial market decline.
Key Levels In Focus: Mapping Bitcoin’s Critical ZonesHighlighting the key levels marked on the chart, Daan Crypto Trades emphasized that the low $80,000 region remains a pivotal zone for bulls in the short to mid-term. He also noted that the $72,000 level, which previously acted as resistance for over two months, has now flipped into a critical support zone.
Maintaining price above this level would reinforce bullish control and suggest that the market is building a solid base for further upside, providing the foundation needed for another leg higher. A breakdown below $72,000, however, would likely indicate that the momentum from the recent bounce is fading, opening the door for more sideways market structure. Although Bitcoin has posted a steady 20% gain throughout April, the price action may not last long, as volatility is expected to emerge at any point.
Why this matters
Bitcoin is a tracked market entity in the DigitalMoneyBox archive, making this useful context for readers monitoring repeated mentions and follow-up coverage.
Original source
Read on NewsBTCRelated market context

Bitcoin (BTC) Price Today: SOPR Turns Bullish as BTC Holds $81K, Eyes $83K-$86K Short Squeeze
Bitcoin price and market data show BTC trading around $81,300 at the latest update, with a 24-hour range between $77,968 and $81,6...

Ethereum (ETH) Price Prediction: $2,400 Support Holds as Bulls Eye $2,570 and $3,000
The latest recovery has pushed Ethereum price back towards $2,446 after buyers defended the important $2,400 support region. ETH p...

ZEC’s 100% rally above $1500 sends Grayscale’s Zcash ETF within $85 million of $1 billion
Grayscale’s Zcash ETF is closing in on $1 billion in assets less than a month after its Wall Street debut. The fund, which trades...

XRP Price Prediction: Ripple Prints Most Bullish RSI Ratio Since Covid
XRP price trades at $1.32, clawing back ground after a brutal two-week stretch that saw it shed its value and prediction from the...

Google Gemini AI Predicts an Explosive End to 2026 for XRP
When prompted, Google Gemini AI predicts that under a full bull market structure between now and 2027, XRP could surge as high as...
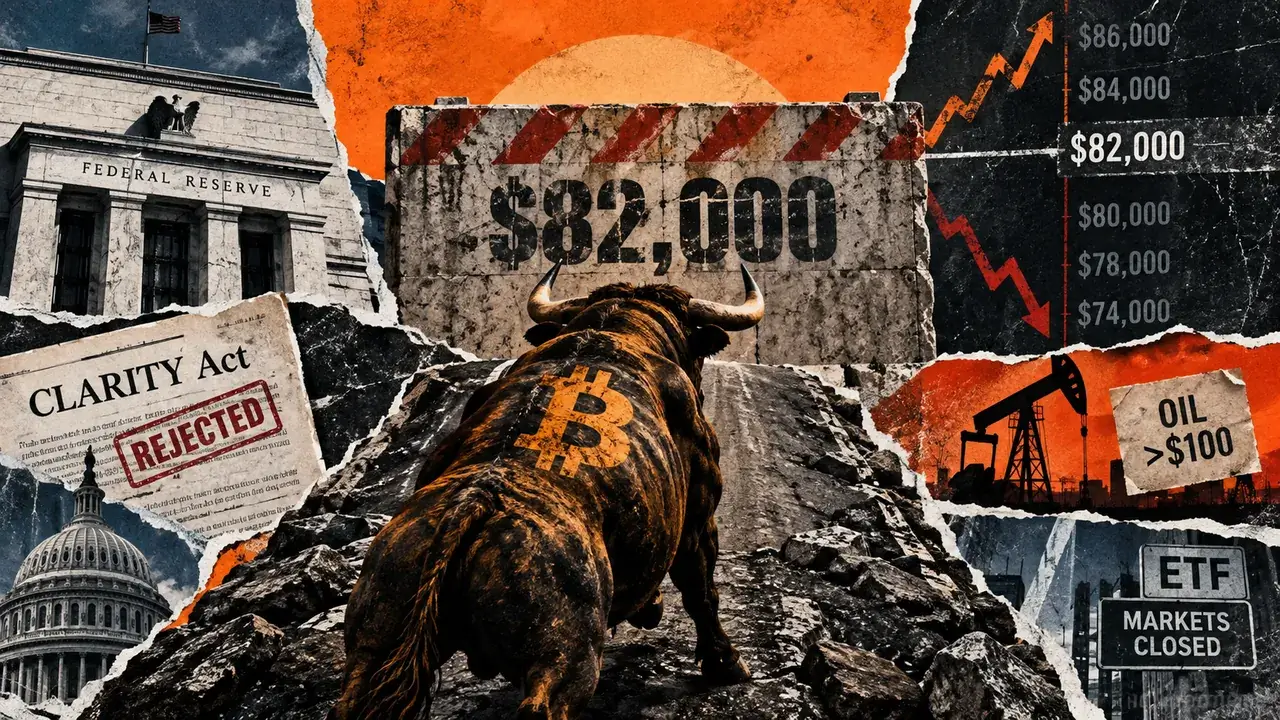
Bitcoin survived the Fed and CLARITY, and now faces the next major test at $82,000 this weekend
Bitcoin hit an intraday high of $81,400 on Friday, approaching the low-$82,000 zone that has capped every recovery attempt since l...