Bitcoin Shows 3 Massive Bullish Signs – BTC Rally To New ATH
It has been just revealed that Bitcoin is showing three important signs that signify that bulls are on their way soon. Check out the latest reports about the matter below. Bitcoin is showing huge bullish potential A well...
Archive context
Older archive item. Useful for background and entity history, but not a fresh market-moving signal.

It has been just revealed that Bitcoin is showing three important signs that signify that bulls are on their way soon. Check out the latest reports about the matter below.
Bitcoin is showing huge bullish potentialA well-known crypto analyst with 418,000 followers on X, who goes by the name of TechDev, has identified three key factors that suggest Bitcoin (BTC) is on track for another surge to new all-time highs.
TechDev has dubbed this the “3-prong signal,” which has previously predicted the four previous BTC rallies to new highs. To support his prediction, TechDev compares a Bitcoin price chart with three other indicators.
The first is his own “global liquidity signal,” which compares the dollar index (DXY) and Chinese 10-year bonds (CN10Y) against the balance sheets of major central banks. This signal attempts to illustrate global cycles of dollar liquidity.
The other two indicators used are the moving average convergence divergence (MACD) and the monthly vortex, both of which have crossed bullish in accordance with traditional interpretation, indicating a trend reversal.
“The 3-prong signal which preceded each of Bitcoin’s four ATH-setting runs:
Break above 20M MA
Monthly MACD bull cross
Monthly Vortex bull cross
…of a global liquidity proxy which oscillates with a ~3.5 year cycle.
And also has a log growth trajectory.”
TechDev posted about data from Glassnode, an analytics firm, that indicates similarities between current on-chain activity and a previous bull run.
The data shows a rise and then leveling off of the amount of BTC that hasn’t been moved in over a year, while the 200-day rate of change of this metric decreases below zero.
TechDev’s green circles indicate that this same pattern occurred during the 2015-2016 market cycle.
Bitcoin is surrounded by highly bullish predictions this year, so we just have to wait and see how this plays out.
Why this matters
This bitcoin story adds another data point to the current market tape and is useful when read alongside nearby source coverage.
Original source
Read on CryptoGazetteRelated market context

David Lawant: Bitcoin Entering New “Bullish Regime” According to Options Market
Bitcoin Magazine David Lawant: Bitcoin Entering New “Bullish Regime” According to Options Market Bitcoin futures open interest is...
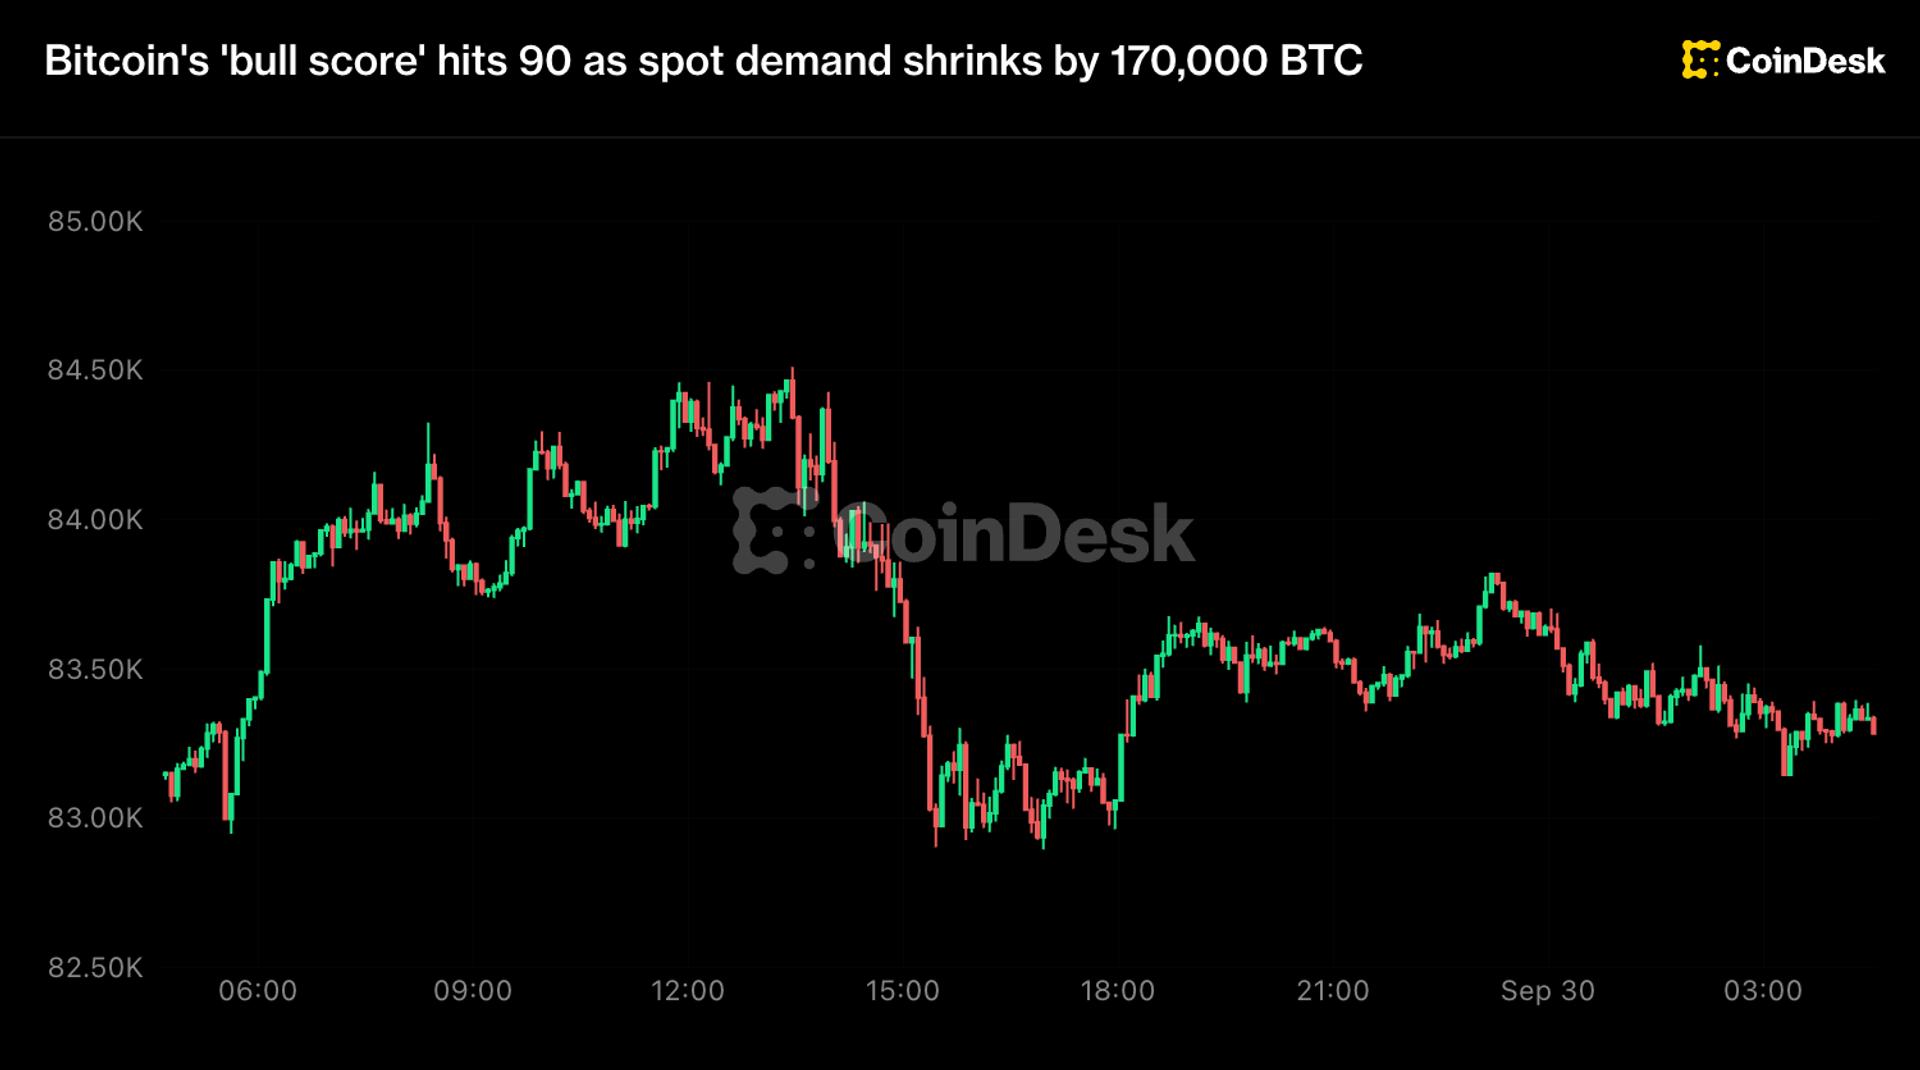
Bitcoin rally shows signs of cooling even as a 'bull score' gauge nears its perfect score
A trend guage tracked on onchain analysis firm CryptoQuant is near its ceiling. The buyers who drove BTC to an eight-month high ar...

Anthropic tokenized pre-IPO volume hits $643M, but liquidity test looms
Anthropic’s planned IPO could force a fast-growing crypto derivatives market to reconcile its synthetic valuation with Wall Street...

SEC changes token buyback guidance as spending hits $638M
The US Securities and Exchange Commission tightened its guidance for crypto token buybacks just three days after publishing it. On...

XRP Price Prediction: Binance XRP Scarcity Index Hits 20-Month Low
XRP is trading at $1.50, down more than 1% over 24 hours, as Binance’s scarcity index signals a sharp reversal in exchange supply...

Bitcoin Price Prediction: Is the BTC Correction Over as It Defies September’s Red Trend?
Bitcoin price is near $83,100, a stable 24-hour movement after retreating from $87,400, and with its prediction still leaning bull...