Bitcoin Trades Sideways — Consolidation Above Support Could Fuel Next Upside
Bitcoin price is consolidating gains above $113,500. BTC could rise further if there is a clear move above the $115,750 resistance. Bitcoin started a fresh upward move above the $114,000 resistance level. The price is tr...
Archive context
Older archive item. Useful for background and entity history, but not a fresh market-moving signal.

Bitcoin price is consolidating gains above $113,500. BTC could rise further if there is a clear move above the $115,750 resistance.
- Bitcoin started a fresh upward move above the $114,000 resistance level.
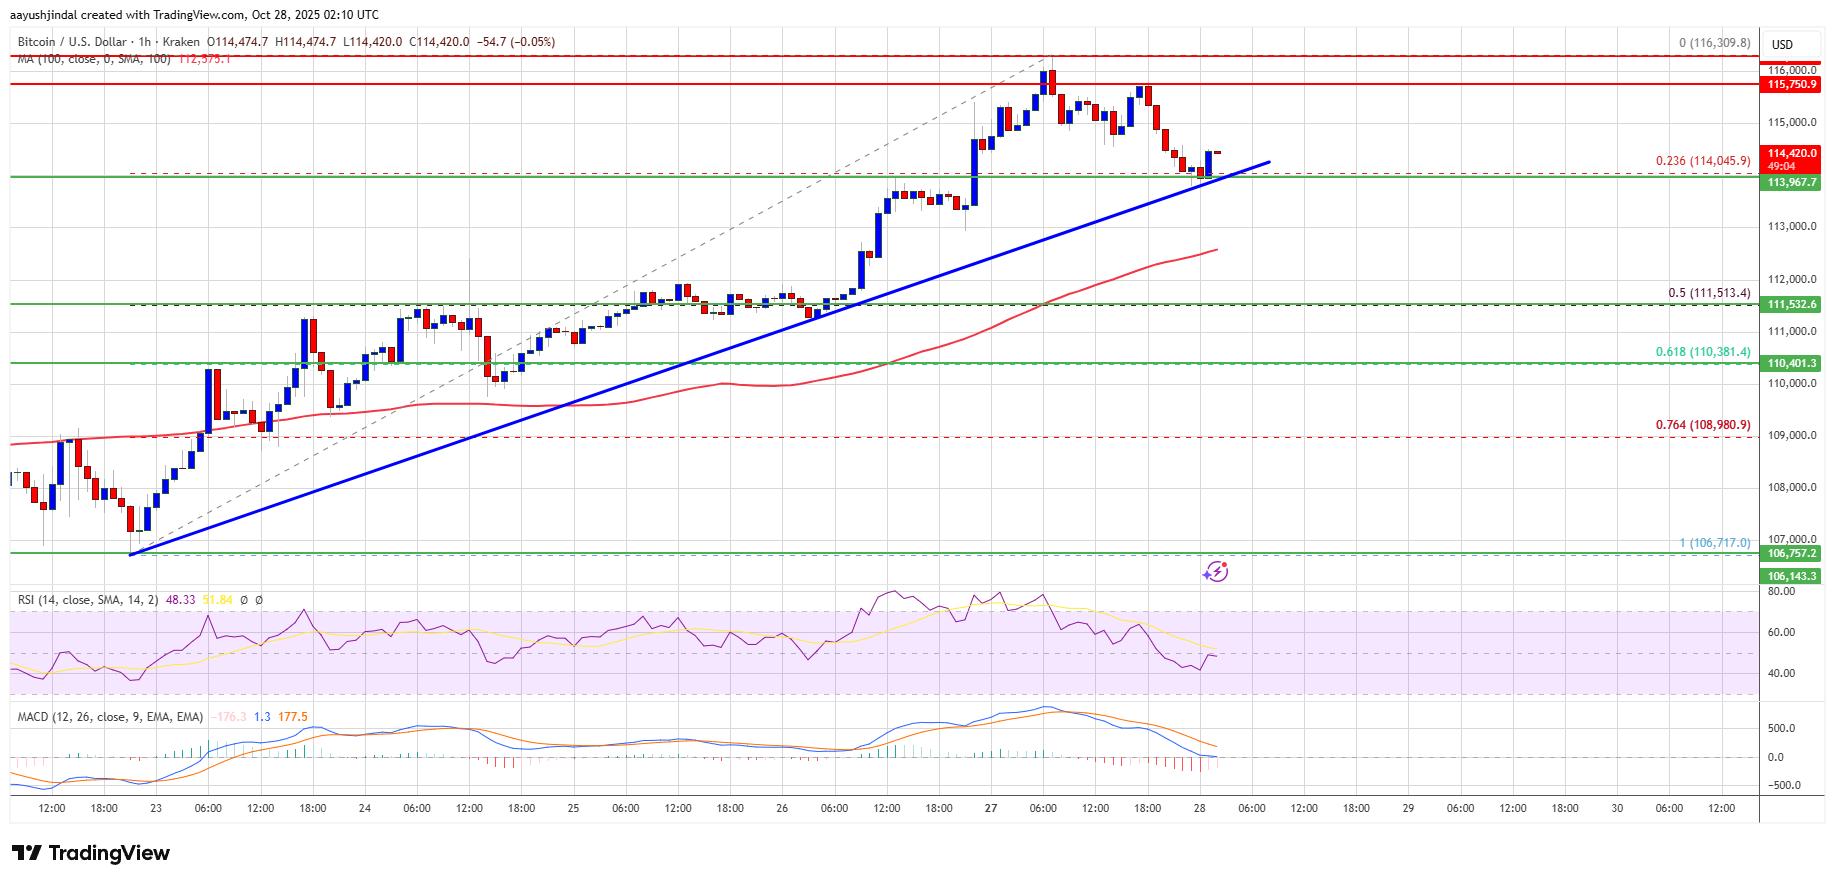
- The price is trading above $114,200 and the 100 hourly Simple moving average.
- There is a bullish trend line forming with support at $113,900 on the hourly chart of the BTC/USD pair (data feed from Kraken).
- The pair might continue to move up if it trades above the $115,750 zone.
Bitcoin price formed a base and started a fresh increase above the $112,500 zone. BTC gained pace for a move above the main hurdle at $113,500.
It opened the doors for a move above $115,000 and the 100 hourly Simple moving average. Finally, the price spiked above $116,000 and is currently consolidating gains above the 23.6% Fib retracement level of the recent wave from the $106,718 swing low to the $116,309 high.
Besides, there is a bullish trend line forming with support at $113,900 on the hourly chart of the BTC/USD pair. Bitcoin is now trading above $114,000 and the 100 hourly Simple moving average.
Immediate resistance on the upside is near the $115,000 level. The first key resistance is near the $115,500 level. The next resistance could be $115,750. A close above the $115,750 resistance might send the price further higher. In the stated case, the price could rise and test the $116,300 resistance. Any more gains might send the price toward the $117,500 level. The next barrier for the bulls could be $118,000.
Another Pullback In BTC?If Bitcoin fails to rise above the $115,500 resistance zone, it could start a fresh decline. Immediate support is near the $114,000 level. The first major support is near the $113,500 level or the trend line.
The next support is now near the $111,000 zone. Any more losses might send the price toward the $110,500 support in the near term. The main support sits at $108,500, below which BTC might struggle to recover in the short term.
Technical indicators:
Hourly MACD – The MACD is now gaining pace in the bullish zone.
Hourly RSI (Relative Strength Index) – The RSI for BTC/USD is now above the 50 level.
Major Support Levels – $114,000, followed by $113,500.
Major Resistance Levels – $115,500 and $116,500.
Why this matters
This bitcoin story adds another data point to the current market tape and is useful when read alongside nearby source coverage.
Original source
Read on NewsBTCRelated market context

XRP Price Prediction: XRP Faces Critical Resistance Near $1.17 Despite Ripple Securing Landmark EU License
While the company secured a full MiCA license that expands its operations across the European Economic Area, market indicators sug...

Bitcoin (BTC) Price Prediction: BTC Holds $63K Support—Can Rising Active Addresses Offset Bearish Technical Signals?
Although the BTC price has remained near a key support zone, recent chart signals and Strategy’s sale of a portion of its Bitcoin...

Bitcoin price rebounds to $63K as leverage returns creating short term volatility risk
Bitcoin's rebound has cleared the first test: price recovered. The harder one starts now: proving buyers remain after the squeeze....

Sui DeFi TVL Breaks $1 Billion As Move-Based Chains Fight For Liquidity
Sui has crossed the $1 billion total value locked mark on DeFiLlama, giving the Move-based network a clearer claim to serious DeFi...

Bitcoin needs trillions to go parabolic again as ETF demand fades
Bitcoin’s next major rally may depend less on whether investors still believe in the asset than on whether enough large balance sh...

Kraken Seeks Final Judgment After $22 Million Award Against Former Auditor
Bitcoin Magazine Kraken Seeks Final Judgment After $22 Million Award Against Former Auditor Payward, the parent company of the cry...