Clear Skies: Why Bitcoin Overhead Resistance Is Weak
Bitcoin price is only at $37,500 — a far cry from former all-time highs around $68,000. However, one visual technical analysis tool could show that overhead resistance is weak, and that the top cryptocurrency could rip r...
Archive context
Older archive item. Useful for background and entity history, but not a fresh market-moving signal.

Bitcoin price is only at $37,500 — a far cry from former all-time highs around $68,000.
However, one visual technical analysis tool could show that overhead resistance is weak, and that the top cryptocurrency could rip right through what’s left. Could BTCUSD be back at all-time highs faster than most are ready for?
Bitcoin Price Breaks Above The Monthly Ichimoku CloudTechnical analysts rely on a variety of tools to help provide signals to visually inspect and either manually or automatically take positions based on the results.
One such tool, created by a Japanese journalist Goichu Hosoda, is called the Ichimoku. Hosoda was nicknamed “Ichimoku Sanjin” which loosely translates to “what the man in the mountain sees.” The idea behind the Ichimoku is that it provides an “at a glance” view of all market conditions.
For example, the cloud plots where future support and resistance may lie. Meanwhile, the Tenkan-sen and Kijun-sen act as trend-following tools that cross bearish and bullish depending on price action. These spans can also act as support and resistance.
With all that out of the way, all it takes is “one glance” at the chart below and we can see there is very little 1M BTCUSD resistance left.
Clear Skies Above Major Resistance, But Minor Pullbacks A PlentyAlso at just a glance, it is possible to see how each time Bitcoin price passed through these spans and the Ichimoku cloud, an extended bull market formed.
It is important to note, however, that the Tenkan-sen (blue) and Kijun-sen (maroon) are still crossed bearish. But this also happened prior to each bull run.
Additionally, the lagging span has been omit from this chart. Called the Chikou span in Japanese, the lagging span shows where former support and resistance used to be, which means Bitcoin does have some less significant resistance levels to contend with at around $43,000 and again around $60,000.
Beyond $60,000, the Ichimoku shows nothing but air. Could this really mean clear skies for Bitcoin once the Ichimoku cloud is officially left behind?
This chart appeared initially in Issue #27 of CoinChartist VIP. Click here to read the rest of the issue.
Why this matters
This bitcoin story adds another data point to the current market tape and is useful when read alongside nearby source coverage.
Original source
Read on NewsBTCRelated market context

Bitcoin (BTC) Price Prediction: $65K Remains Key Resistance as 4-Year Cycle Model Signals Make-or-Break Moment
The Bitcoin price today remains around $62,600-$62,900, according to TradingView data, reflecting a market that has stabilized fol...

Litecoin (LTC) Price Prediction: Mixed Technical Signals and Growing Hashrate Keep Traders Focused on $39 Support and $46 Breakout
Analysts are closely watching whether the Litecoin price can maintain support around $39 and break above the key $46 resistance le...
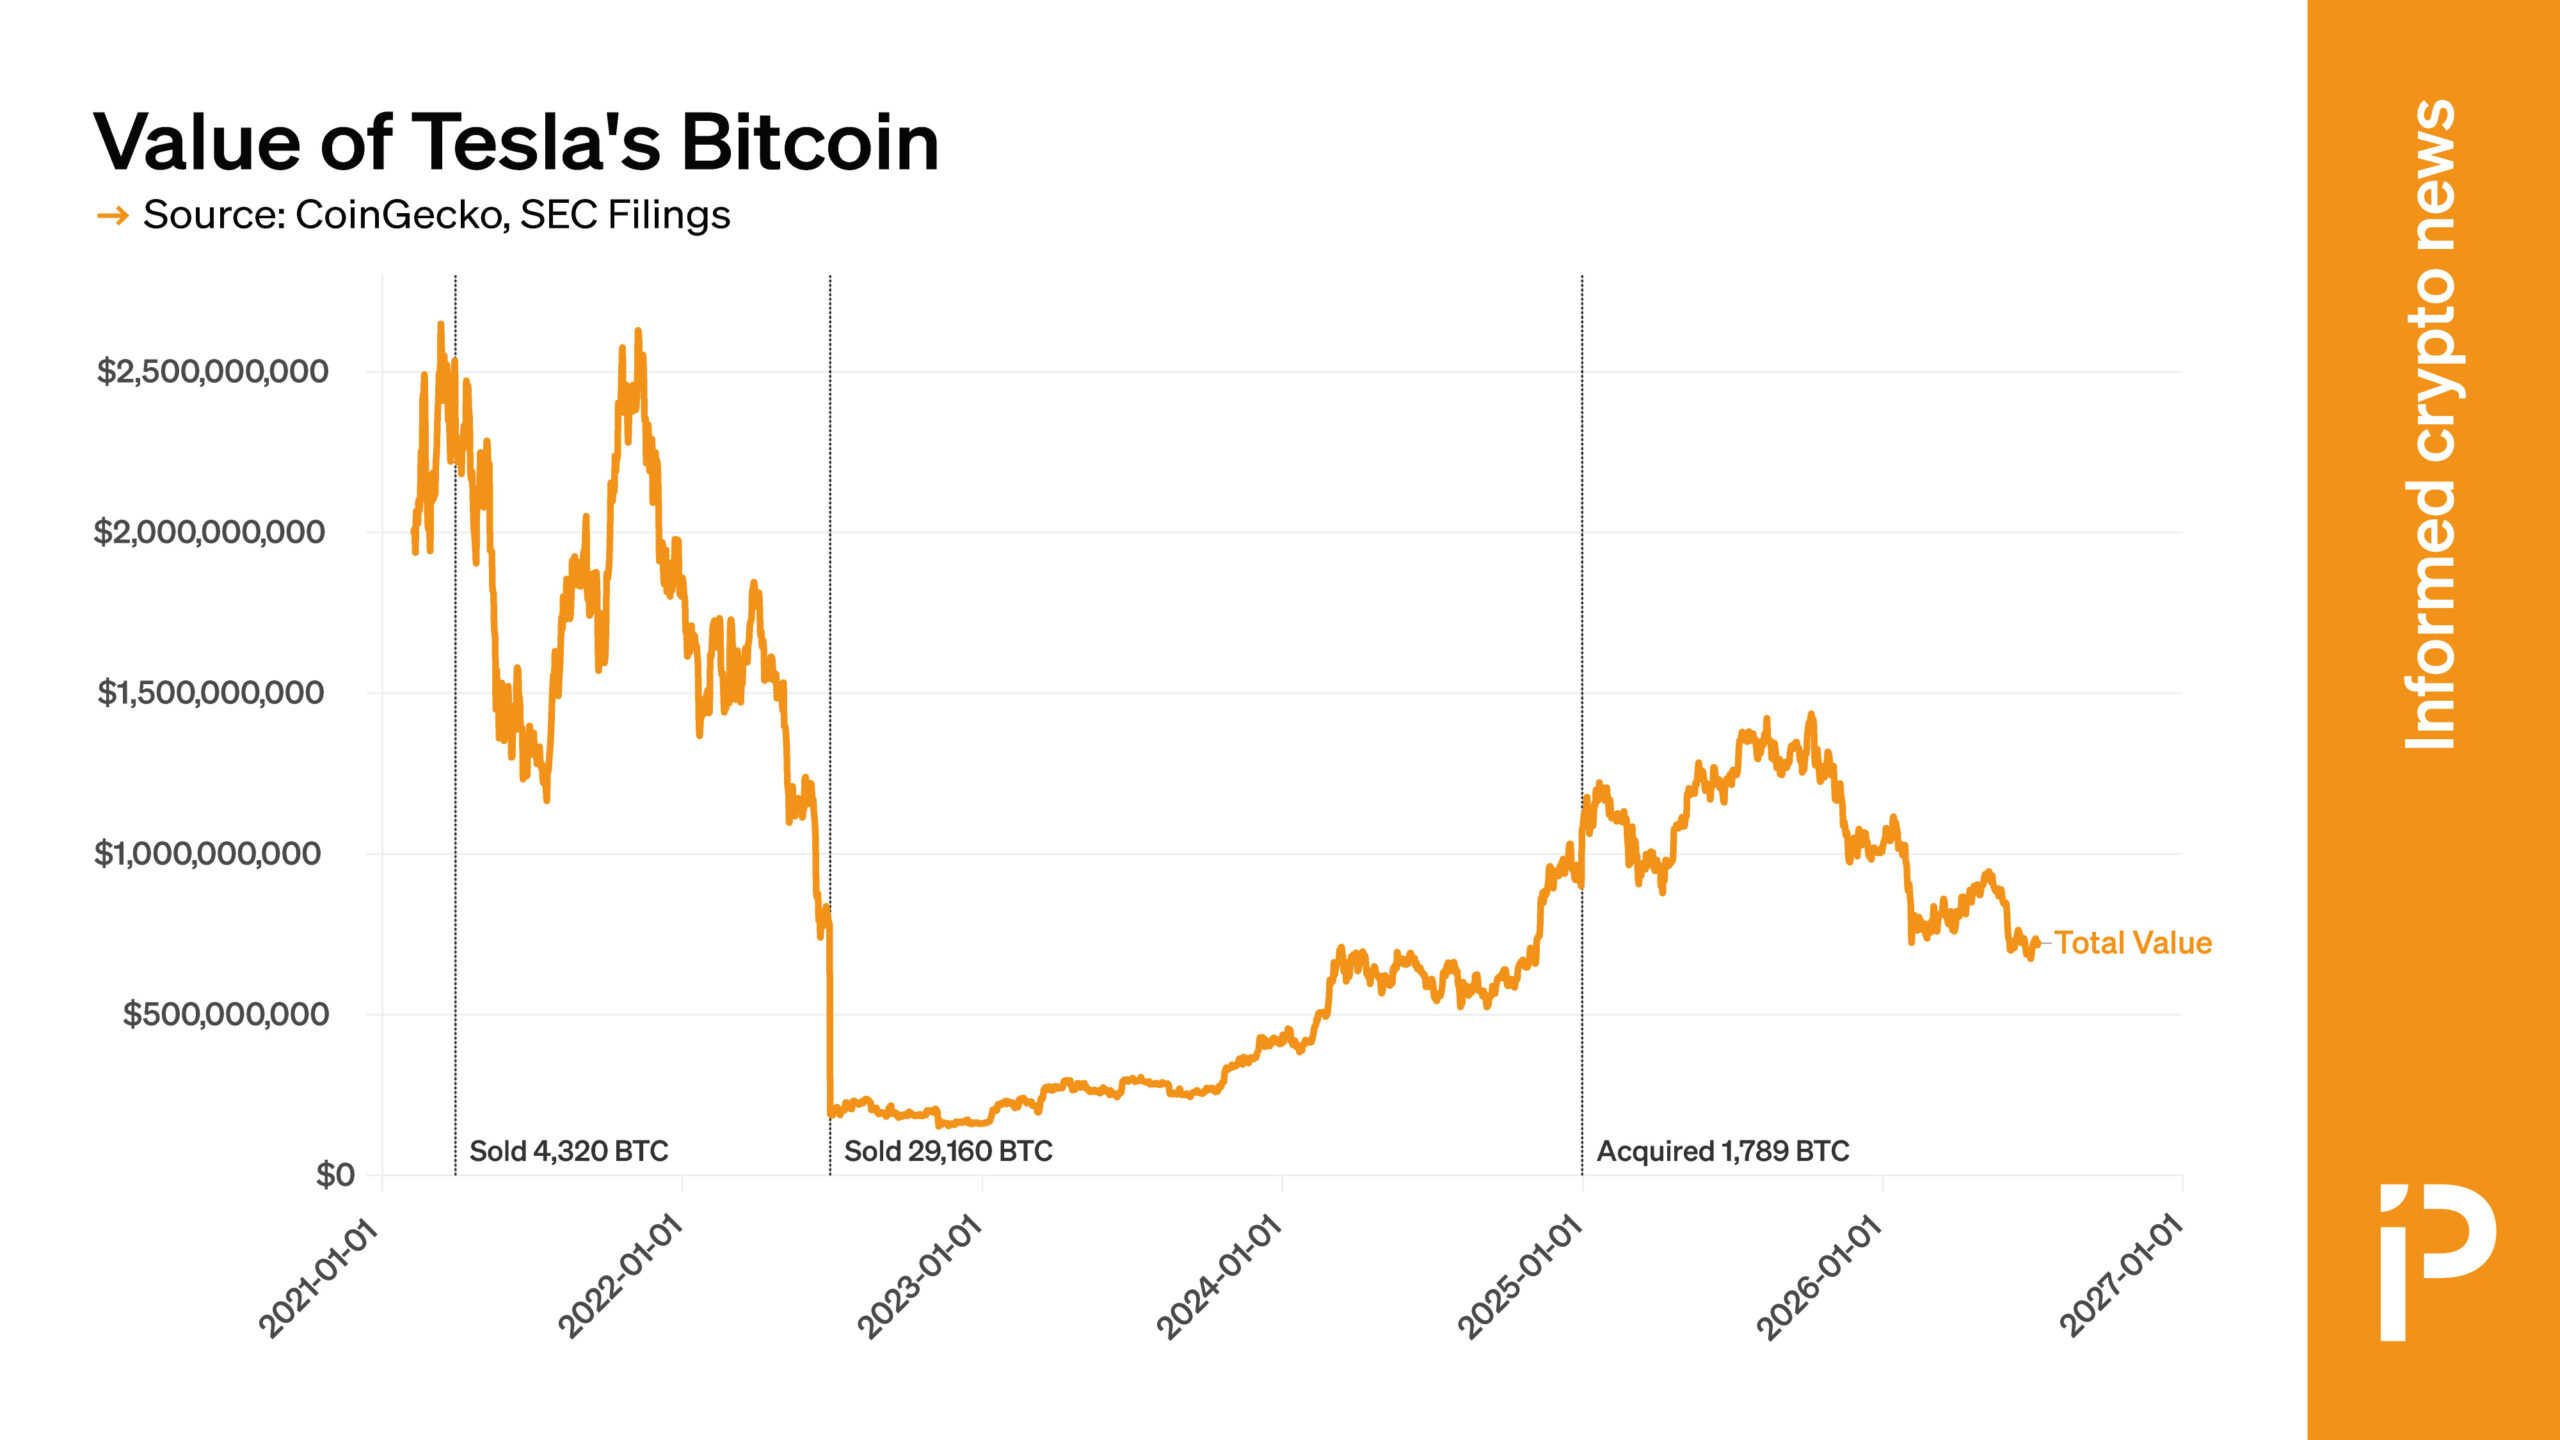
CHART: Value of Tesla’s BTC holdings have fallen by two-thirds
Tesla became one of the early firms to embrace BTC, adding it to its balance sheet in 2021; however, it all but abandoned this ini...

Bitcoin Price Prediction: Overlooked BTC Gold Ratio Is Flashing an Unexpected Signal
Bitcoin is hovering around $62,000, but the mood feels far less comfortable than the chart suggests. Bitcoin price prediction deba...

Aave V4 Clears Formal Verification as Certora Confirms Core Protocol Security and Solvency
Key Takeaways: Certora has officially validated the core smart contracts of Aave V4, such as the Liquidity Hub and Spoke modules....

Schwab Strategist Backs Strategy’s STRC Playbook Amid Bitcoin Weakness
Bitcoin Magazine Schwab Strategist Backs Strategy’s STRC Playbook Amid Bitcoin Weakness Strategy remains under pressure as Bitcoin...