Every Time This Bitcoin Metric Crossed This Level, The Market Bottomed — It Just Happened Again
Bitcoin closed the week of June 5 with a nearly 20% decline — its sharpest single-week drop since the FTX collapse in November 2022 — but on-chain analyst Ali Martinez is pushing back against the prevailing fear, arguing...
Archive context
Older archive item. Useful for background and entity history, but not a fresh market-moving signal.

Bitcoin closed the week of June 5 with a nearly 20% decline — its sharpest single-week drop since the FTX collapse in November 2022 — but on-chain analyst Ali Martinez is pushing back against the prevailing fear, arguing in a technical post on X that the market is approaching a major macro accumulation cycle rather than the beginning of a deeper structural breakdown.
Martinez’s case rests on a convergence of on-chain metrics that have historically accompanied market bottoms rather than preceded further selling. Bitcoin’s decline to $59,000 — its lowest level since 2024 — flushed out what he describes as “overleveraged premiums” across the board, per his X post. That kind of forced deleveraging, he argues, is typically what creates the conditions for a genuine bottom rather than a temporary bounce.
The Bitcoin Metrics Behind The CallTwo data points sit at the center of Martinez’s analysis. The first is long-term holder behavior. During the recent downswing, long-term investors distributed more than $3.25 billion in spot Bitcoin, temporarily pushing exchange reserves higher and increasing potential short-term selling pressure. That distribution, Martinez notes, is consistent with what has historically marked the final phase of supply absorption before accumulation begins.
The second is supply held at a loss. Bitcoin’s drop to $59,000 pushed more than 10.46 million BTC into an underwater position. According to Martinez’s post, every previous instance where the supply-in-loss metric crossed the 10 million threshold has accurately timed macro bottoms in prior cycles — a signal he considers one of the most reliable indicators available.
Bitcoin $BTC market bottom is closer than you think.
Here’s where I’m planning to buy. https://t.co/DrI4OJXnL7 pic.twitter.com/j3YQNzw02G
— Ali Charts (@alicharts) June 10, 2026
Where The Bottom Could LandRather than calling a specific price floor, Martinez identified two accumulation zones based on MVRV band analysis — the ratio of Bitcoin’s market value to its realized value. The most reliable accumulation windows historically appear when MVRV settles between the 1.0 and 0.8 bands, which currently correspond to approximately $53,900 and $43,150, per his analysis. He is also tracking three key moving averages as structural reference points: the 200-week simple moving average at $62,800, the 300-week at $55,000, and the 400-week at $42,500.
Fellow analyst Benjamin Cowen separately echoed the assessment, telling his audience that investor psychology is approaching the territory historically associated with major cycle bottoms — a phase he estimates could extend through Q3 and potentially into October.
As of this writing, Bitcoin trades at around $63,000, recovering from the $59,000 lows as the market processes whether the worst week since FTX marked a capitulation bottom or simply the latest step in a longer correction.
Cover image from Grok, BTCUD chart from Tradingview
Why this matters
Bitcoin is showing up inside the Macro & Rates theme, so this story is worth tracking for follow-through rather than treating it as a one-off headline.
Original source
Read on NewsBTCRelated market context

What Is Crypto Spot Trading?
For example, a token can be up 70% and still be a terrible trade if you have no idea when to take profits. Likewise, a 30% dip can...

What happens when crypto trades stocks while Wall Street sleeps?
Wall Street closes at 4 p.m., but apparently that's becoming more of a suggestion than a rule. You can now spend the evening watch...

Ethereum ETFs see largest weekly net outflow since January
The significant outflows from Ethereum ETFs may signal waning investor confidence and broader bearish sentiment in the crypto mark...

Bitcoin’s weekend rebound faces an $80,400 test after nearly $730 million in ETF outflows
Bitcoin traded near $82,900 in PerpFinder’s Oct. 10, 09:36 UTC snapshot, with traders watching whether the weekend rebound brings...

Bitcoin Price Prediction: Can BTC USD Hold $82K Ahead of Next Week’s CPI Drop?
Bitcoin price prediction notes a brief recovery on Saturday, October 10, but the market remains poised for a weekly loss as rising...
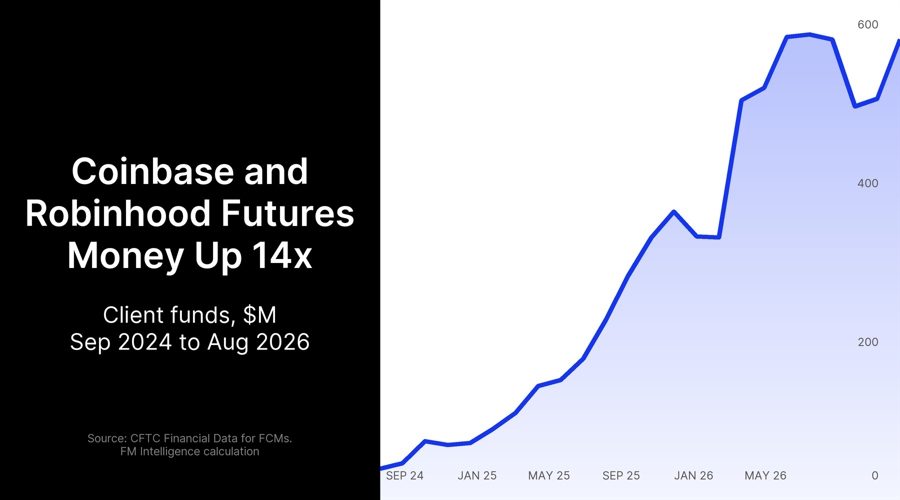
Coinbase and Robinhood Futures Arms Now Hold More Client Money Than the US Retail Forex Pool
The futures brokers of Coinbase and Robinhood held $581.4 million of segregated client money at the end of August. That is more th...