Has Bitcoin Bottomed At $60,000 To Return To $100,000, Or Is This Just The Start Of Another Crash?
Bitcoin is still trading above $60,000, but there are questions as to whether that area has already become the macro bottom for this correction or whether another crash could still drag the price back into that zone. Tec...
Archive context
Older archive item. Useful for background and entity history, but not a fresh market-moving signal.

Bitcoin is still trading above $60,000, but there are questions as to whether that area has already become the macro bottom for this correction or whether another crash could still drag the price back into that zone. Technical analysis using Bitcoin’s weekly RSI, prior cycle support, and the 21-week and 50-week EMA trend presents the bullish side of that trend, but bears can still argue that confirmation has not arrived until Bitcoin breaks above the weekly EMA structure.
Bitcoin Might Have Bottomed AlreadyThe strongest argument that Bitcoin may have already bottomed is from the weekly RSI indicator. According to the thesis shared by Cryptoposeidon on X, Bitcoin’s weekly RSI has fallen below 30 only four times in history. The first three came around the January 2015, December 2018, and June 2022 lows, all of which later became macro bottom zones.
Back in January 2015, Bitcoin’s RSI fell to about 28 when the price fell to $200. A similar pattern played out in December 2018, when RSI dipped below 30 around $3,500, followed by about three months of sideways accumulation before Bitcoin broke higher. The third instance was June 2022, in the depths of the bear market that followed the Luna collapse.
The fourth reading came in early February 2026, shortly after Bitcoin’s crash into a bottom around $63,000, and this supports the proposal that Bitcoin may have already gone through its major capitulation phase.
The weekly candlestick timeframe chart below also shows the RSI recovering from a low band similar to the previous bear-market bottom zones, with the projected path suggesting that momentum could spend more time rebuilding before a stronger move returns in 2027.
Bitcoin Price Chart. Source: @CryptoPoseidonn On X
What Confirmation And Return To $100,000 Actually Looks LikeThe last two bear markets both took 364 days to move from peak to trough. The current correction is now 236 days old, which leaves a 128-day window for Bitcoin to make another low if it follows the same timing pattern.
However, looking at November 2022, Bitcoin broke below the prior cycle’s $19,900 peak and collapsed to $15,500, spending a brief period under $16,000. That breakdown was forced by the FTX implosion, a black swan event that liquidated billions in assets and obliterated confidence simultaneously. Without a comparable catalytic shock, current crypto market dynamics lack the mechanism to sustain prices below $60,000 within the remaining 128-day window for a bottom.
Bitcoin’s long-term support band is between $58,000 and $66,000, and the February 2026 low is inside that range. Bitcoin can still wick to $55,000 or even $50,000 in a liquidation event, but spending a long period below $60,000 would require a very strong bearish catalyst.
On the other hand, a reclaim and monthly close above the weekly EMA and $80,000 in June 2026 would change the conversation from “Is $60,000 the bottom?” to “How fast can Bitcoin rebuild toward $100,000?” At the time of writing, Bitcoin is trading at $72,860, down by 1.2% in the past 24 hours.
Why this matters
Bitcoin is showing up inside the Macro & Rates theme, so this story is worth tracking for follow-through rather than treating it as a one-off headline.
Original source
Read on NewsBTCRelated market context

Bitcoin’s $19 billion crash still shapes crypto risk a year later
The 10/10 crash highlighted crypto's vulnerability to external shocks, prompting calls for better risk management and transparency...
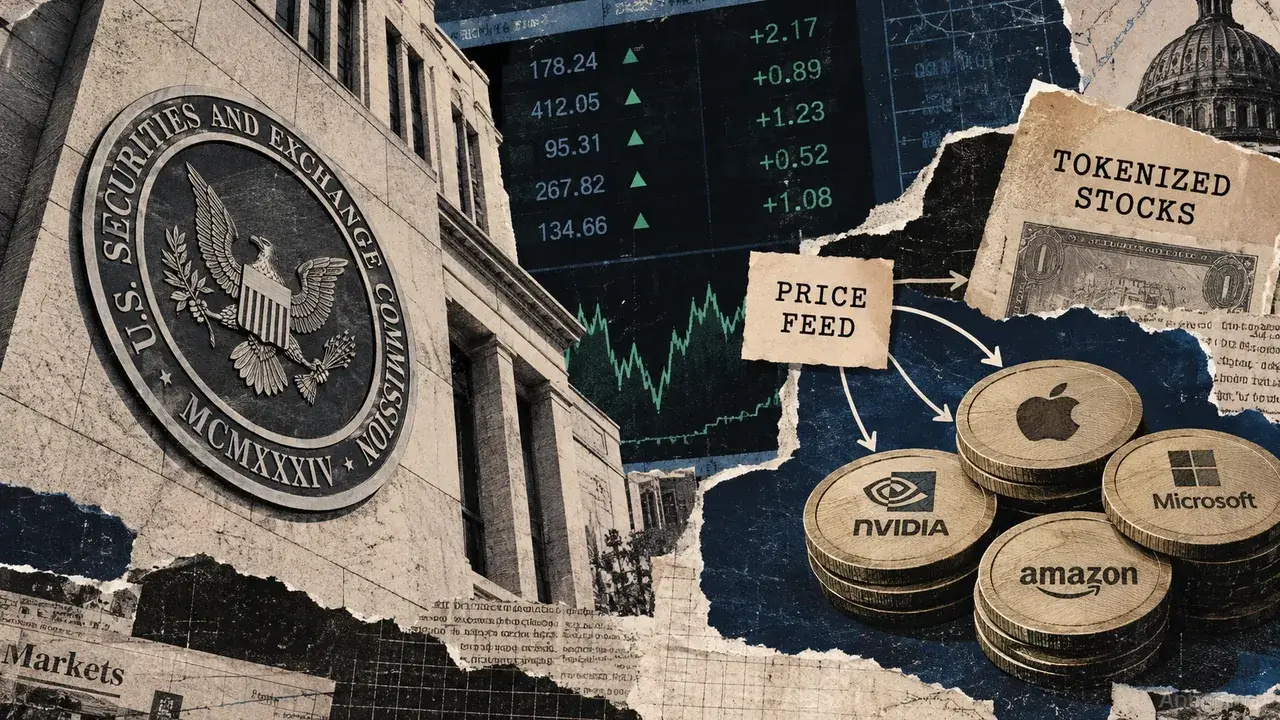
Tokenized stocks can carry the same rights without the same trading protections
Tokenized stocks eligible for the SEC’s September exemption must carry equivalent shareholder rights, yet their trading venues can...

Bitcoin companies are learning that holding forever takes cash
Metaplanet sold 10,000 BTC and bought back 11,000 at a higher average price to show it was willing to sell its Bitcoin. The Japane...

What Is Crypto Spot Trading?
For example, a token can be up 70% and still be a terrible trade if you have no idea when to take profits. Likewise, a 30% dip can...

Meta AI Predicts This Huge Catalyst Could Lead to $40 XRP
Mark Zuckerberg’s Meta AI predicts an insanely wild bullish price target for XRP by January 1, 2027. The AI bot believes $25–$40 i...

XRP’s next Wall Street expansion comes with an unexpected complication from Ripple
Evernorth is preparing to begin trading on Nasdaq on Monday, bringing approximately 473 million XRP into a publicly traded treasur...