How Bitcoin Exchange Outflows Rose In January
January was the largest month for bitcoin exchange outflows since September 2021.The below is from a recent edition of the Deep Dive, Bitcoin Magazine's premium markets newsletter. To be among the first to receive these...
Archive context
Older archive item. Useful for background and entity history, but not a fresh market-moving signal.
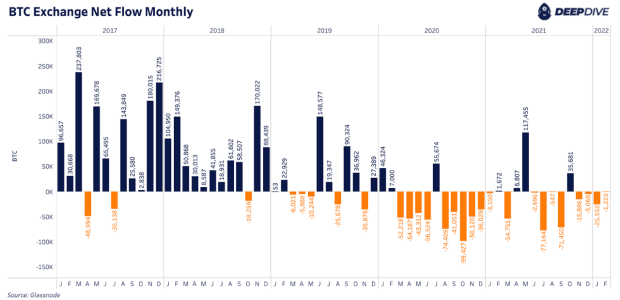
January was the largest month for bitcoin exchange outflows since September 2021.
The below is from a recent edition of the Deep Dive, Bitcoin Magazine's premium markets newsletter. To be among the first to receive these insights and other on-chain bitcoin market analysis straight to your inbox, subscribe now.
As we’ve discussed in previous Daily Dives, March 2020 was a significant catalyst and turning point for bitcoin. We can see that in the behavior of exchange balances which have shown consistent net outflow over the last two years.
The two most recent periods of significant inflows were right before both 2021 bitcoin local price tops. These tops in April and November coincided with the previous month showing net exchange inflows of bitcoin in both March and October.
January was the largest outflow month since September 2021. Keeping an eye on exchange flow dynamics can help us track demand sentiment and when that is fundamentally changing for market participants.
Source: GlassnodeThe 90-day cumulative exchange flow has consistently moved with price over the last year. In the chart below, the right-hand side axis is reversed to show how a decreasing net exchange flow correlates with a rising price and vice versa.
What we’ve seen in January is a turning point in the 90-day cumulative netflow with more bitcoin flowing out of exchanges. This signals increased buying demand over the last month and we’ve seen bitcoin price follow suit over the last few days. This is happening while we’re also seeing accumulation trends in long-term holders and whales over the last few weeks.
Source: GlassnodeLooking at the 30-day change in exchange balances, we’ve seen a strong deceleration over the last two weeks.
Source: GlassnodeAnother way to view exchange volume dynamics is to look at the net exchange flow relative to estimates for adjusted supply. Adjusted supply removes coins that haven’t moved in seven years which is an assumption to account for Satoshi’s coins and lost coins. Current adjusted supply is approximately 15.58 million bitcoin, 82.2% of the circulating supply.
Why this matters
This bitcoin story adds another data point to the current market tape and is useful when read alongside nearby source coverage.
Original source
Read on Bitcoin MagazineRelated market context

Ethereum’s past outflow charts can change when more exchange wallets are identified
Coin Metrics has rebuilt Ethereum's historical Standard Flow Metrics, raising a timing problem for tests that treat exchange outfl...

India’s local crypto exchanges get just 0.7% of inflows, Chainalysis reports
India’s crypto users send substantial value to centralized exchanges, but domestic platforms receive just 0.7% of exchange value i...

Bitcoin Price Stays Out of the Red as This Bear Market Breaks a Historic Pattern
Bitcoin price drawdown never produced a daily close below realized price this cycle, while aggregate NUPL remained positive throug...

Bitcoin’s $85,000 recovery awaits proof that ETF investors kept buying after payrolls
Bitcoin's recovery above $85,000 faces a demand test after a sharp fall in bets on another Federal Reserve rate hike. A new post-p...

The same Fed rate hike can help stablecoins and hurt Bitcoin borrowers
When you hold a dollar stablecoin, somebody else may be earning interest on the assets backing your balance, while a company borro...

XRP Price, $300M ETF Demand, and 45% Q3 Supply Overhang
XRP price rose more than 45% in Q3 as U.S. spot XRP ETFs attracted about $307.9 million, yet the token entered October near $1.50...