Is Bitcoin ‘Uptober’ About To Begin? | BTCUSD Analysis October 3, 2022
In this episode of NewsBTC’s daily technical analysis videos, we review a variety of technical and fundamental signals on the Bitcoin price monthly chart to see if we are getting closer to a bottom in crypto. Take a look...
Archive context
Older archive item. Useful for background and entity history, but not a fresh market-moving signal.

In this episode of NewsBTC’s daily technical analysis videos, we review a variety of technical and fundamental signals on the Bitcoin price monthly chart to see if we are getting closer to a bottom in crypto.
Take a look at the video below:
VIDEO: Bitcoin Price Analysis (BTCUSD): October 3, 2022The monthly closed with a doji candle, which typically forms at a point of indecision before either a reversal, or strong continuation. Past monthly dojis have commonly preceded short- and long-term turning points in crypto. The September monthly candle was the first ever monthly close below Bitcoin’s former all time high set back in December of 2017.
Although Bitcoin was clearly overvalued back then, it is hard to imagine in today’s world that the top cryptocurrency is still overvalued a full five years later.
Bearish BTC Momentum Begins To Wane… MaybeThe October monthly candle opened with pink on the LMACD histogram. This signal in the past put bear markets back into hibernation mode for at least a year or more, and suggests a major shift in momentum. But October must close bullish to confirm and cement the change in color on the Bitcoin monthly chart.
The monthly Relative Strength Index remains the lowest in Bitcoin history, but is grinding along the bottom of a downward sloping channel. The same downward slope has connected past RSI peaks.
Bitcoin bearish momentum might be weakening | Source: BTCUSD on TradingView.com Bitcoin Investors Could Be Getting Over Their LossThe Coppock Curve has also finally touched down at the same level where past bear market bottoms have occurred. Time cycle tools also suggest there could be some rhythmic behavior to Bitcoin that is about to unfold.
The Coppock Curve was created by E.S.C. Coppock, who was asked by his church to identify long-term buying opportunities for investors. It is based on the idea that it takes between 11 and 14 months for a bear market to end, as that’s roughly how long it takes for a human to get over mourning a significant loss.
Bear markets take at minimum 14 months | Source: BTCUSD on TradingView.comRelated Reading: Bitcoin & The Global Currency Meltdown | BTCUSD September 28, 2022
Did Satoshi Call The Bottom In Crypto?Another possible bottom signal isn’t technical, but fundamental. Bitcoin price has now been in the lower range of the cost of production at about the same length of time as the 2018 bear market bottom.
This is notable, because in commodities, prices bottom out near the cost of production. Even Bitcoin’s creator, Satoshi Nakamoto spoke of this.
“The price of any commodity tends to gravitate toward the production cost. If the price is below cost, then production slows down. If the price is above cost, profit can be made by generating and selling more. At the same time, the increased production would increase the difficulty, pushing the cost of generating towards the price.”
Has Bitcoin bottomed at the cost of production? | Source: BTCUSD on TradingView.comLearn crypto technical analysis yourself with the NewsBTC Trading Course. Click here to access the free educational program.
Here is a $49 discount pass to 21 Days To Better Crypto Trading by @elliottwaveintl. It gets you instant access to 3 learning resources on how to trade crypto using EW, the Crypto Trader’s Classroom service, & on Oct.5, access to the Crypto Pro Service
https://t.co/ICKzvNnvG5 pic.twitter.com/gAyKxTdQNl
— Tony "The Bull" Spilotro (@tonyspilotroBTC) September 28, 2022
Follow @TonySpilotroBTC on Twitter or join the TonyTradesBTC Telegram for exclusive daily market insights and technical analysis education. Please note: Content is educational and should not be considered investment advice.
Featured image from iStockPhoto, Charts from TradingView.comWhy this matters
This bitcoin story adds another data point to the current market tape and is useful when read alongside nearby source coverage.
Original source
Read on NewsBTCRelated market context
Dune Adds Real-Time Spot And Perpetual Trade Feeds Across On-Chain Markets
TL;DR: Dune has launched normalized real-time feeds for spot and perpetual DEX trades, designed to help institutional desks compar...
Bitcoin Hashrate Reclaims One Zettahash As Mining Competition Rebounds
TL;DR: BlocksBridge reported Bitcoin’s seven-day hashrate above one zettahash in the week to October 22. Mining competition has re...
Bitcoin ETF Flows Trail Price Moves, DWF Study Finds
Bitcoin ETF flows track recent price moves more closely than subsequent ones, according to DWF Labs research published October 22....
Bitdeer Reports 1,355 Bitcoin Mined In September While Building AI Capacity
TL;DR: Bitdeer says its September Bitcoin production reached 1,355 BTC, highlighting the miner’s expanding hash rate alongside sep...
Bitwise Dogecoin ETF Reaches Scheduled Liquidation As Holders Face Cash Redemption
TL;DR: Bitwise’s BWOW Dogecoin ETF reached its announced October 22 liquidation distribution date, with remaining shareholders due...
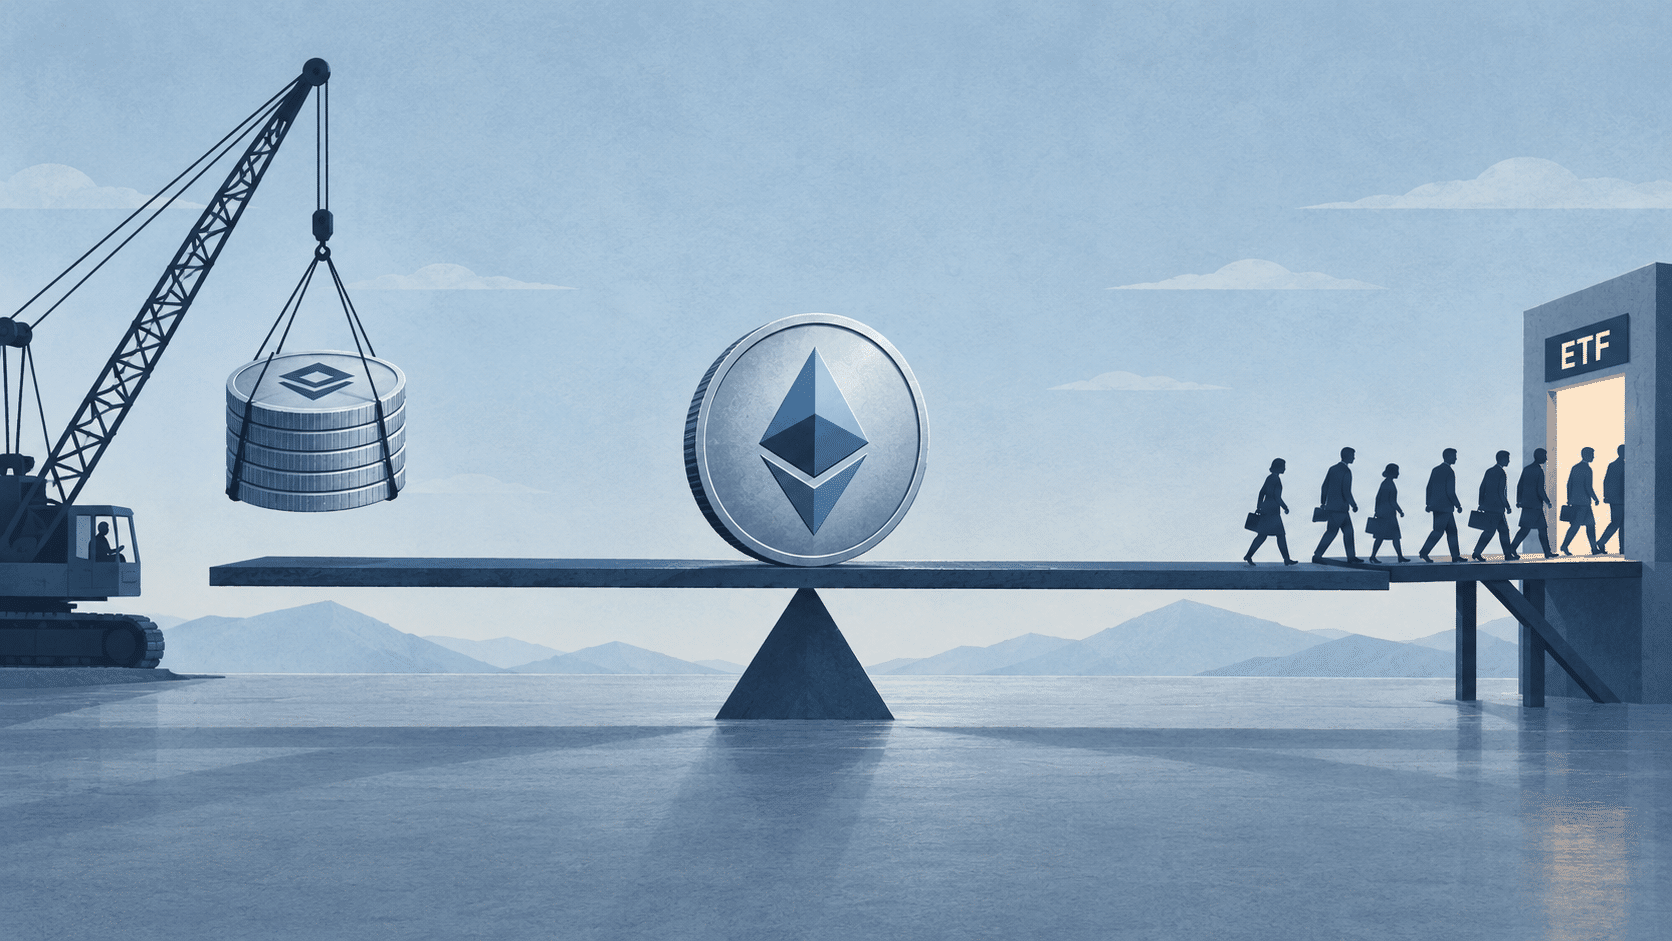
Ether ETFs Are Having Their Worst Month of 2026. Who Buys Once Bitmine Stops?
Ether’s (ETH) demand this year has largely come from two places: spot exchange-traded funds (ETFs) and Bitmine Immersion Technolog...