Is The Bottom In For The Bitcoin Price?
After the September FOMC meeting, Bitcoin Magazine Pro recaps the medium-term thesis for bitcoin and how to think about the looming macro volatility. The below is an excerpt from a recent edition of Bitcoin Magazine Pro,...
Archive context
Older archive item. Useful for background and entity history, but not a fresh market-moving signal.

After the September FOMC meeting, Bitcoin Magazine Pro recaps the medium-term thesis for bitcoin and how to think about the looming macro volatility.
The below is an excerpt from a recent edition of Bitcoin Magazine Pro, Bitcoin Magazine's premium markets newsletter. To be among the first to receive these insights and other on-chain bitcoin market analysis straight to your inbox, subscribe now.
Maximum Pain: Still Ahead Of UsThe word of the day is pain. That was Federal Reserve Chairman Jerome Powell’s favorite go-to in the September Federal Open Market Committee meeting. One simple economic release and subsequent press conference sent the market into a period of mild panic with rates soaring higher, volatility heating up and equities selling off with bitcoin following. The S&P 500 Index lost a critical support level of 3850, bitcoin was sent back to local lows of $18,100 and the 2-year Treasury went over 4.1%.
Even an expected 75 basis point hike was not enough to turn markets around as the complementary info across the Fed’s forecasts and Powell’s speech gave risk assets more to be concerned about. Powell reiterated many times that more economic pain (job losses, housing market declines, etc.) is coming as a result to solve the inflation problem at hand. He cited a lack of disinflation in their favorite “core PCE” (personal consumption expenditures) measure and reiterated his Jackson Hole hawkish speech, noting that they won’t stop until the job is done.
It’s now do or die for risk assets with the options to see an immediate relief rally this week or likely more downward continuation in valuations and prices across the board.
Our thesis here at Bitcoin Magazine Pro, as long-term bull-biased bitcoin proponents, is that the macroeconomic headwinds are in the driver’s seat, and given the price action in global currency and bond markets, the ultimate panic moment has yet to arrive. We are open-minded and flexible to change that stance, but as objective market analysts, we see and report what is in front of us. More on this later.
On-ChainAlthough on-chain cyclical metrics can prove useful for assessing long-term value buying (or selling) opportunities and Bitcoin’s economic behavior, we’ve highlighted less of them over the last few months as we felt they were less relevant to short-term price action compared to current macro headwinds.
Looking at the history of bitcoin market cycles, when diving into on-chain data, one immediately notices the consistency in which the bitcoin price falls below its realized price (average cost basis of all bitcoin as per their last movement on-chain) during the depths of a bear market. In previous cycles, that’s not been a one-off event but rather one that also comes with duration. We’ve been emphasizing for months that this bear market can last longer than most expect and that the duration component is more painful than the percentage drawdown.
“As the average holder is underwater, most marginal sellers have already sold their holdings, and while further downside is possible, the ‘pain’ market participants feel is in the form of a prolonged period of time spent underwater rather than rapidly declining prices that characterized the start of the bear market.” - When Will The Bear Market End? July 11, 2022
The BTC/USD daily exchange rate is set completely at the margin and, given the increasing macroeconomic headwinds, marginal sellers have and likely continue to dominate marginal buyers until a distinct change in liquidity conditions occurs.
A more zoomed-out view shows that this drawn-out process of capitulation transfers the coins into stronger, and more well-capitalized hands.
Bitcoin price weighted by the realized price shows that we are in bear territory but still have room below.For those that see this as the time to get long-term undervalued bitcoin, the realized market cap is an assuring chart which shows the log growth of bitcoin’s cost basis over time. The cost basis has only dropped a maximum of 24.07% from cycle highs and is currently down 12.71%. This is the chart which we think most “non-bitcoin” investors don’t grasp. Even in the “everything speculative” bubble, which bitcoin is a part of, the cost basis of the network is ever increasing or marginally declining despite the wild daily exchange rate volatility.
The cost basis is currently down only 12.71%.Why this matters
This bitcoin story adds another data point to the current market tape and is useful when read alongside nearby source coverage.
Original source
Read on Bitcoin MagazineRelated market context
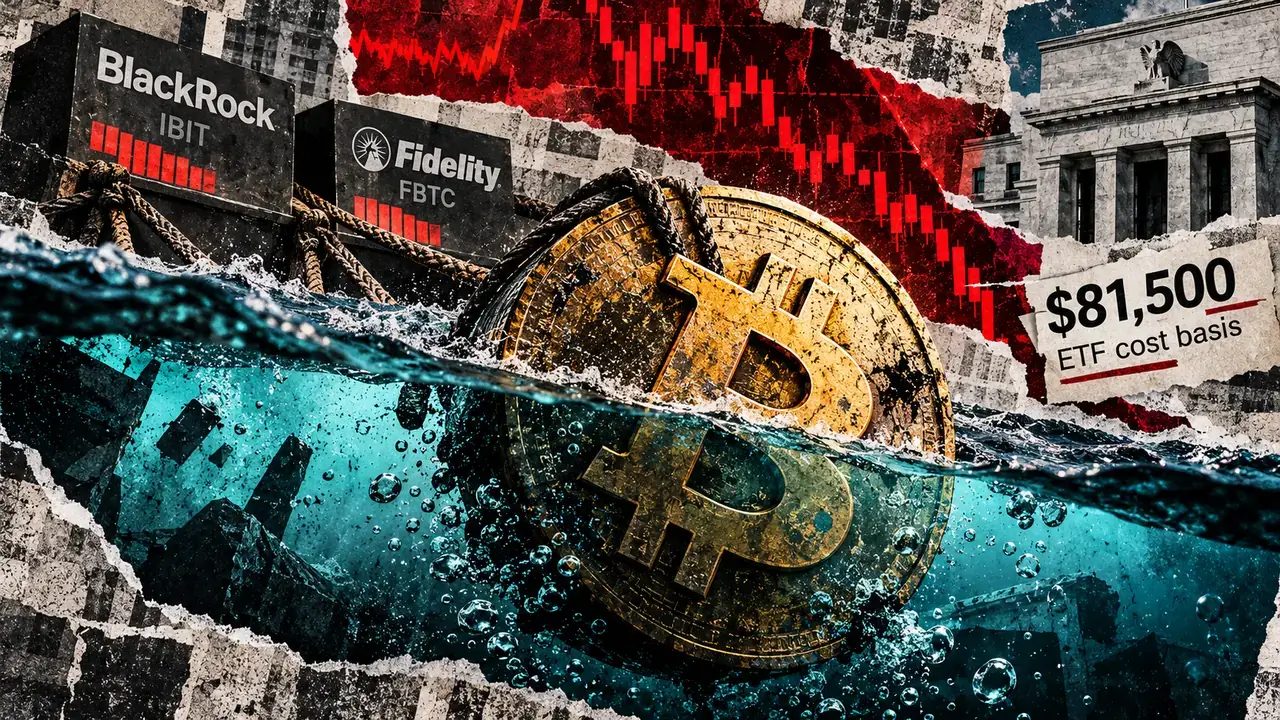
Bitcoin ETFs shed $635 million as BTC tests their holdings’ estimated $81,500 cost basis
US spot Bitcoin exchange-traded funds recorded about $635 million in net outflows Thursday as the cryptocurrency traded near the e...
Dune Adds Real-Time Spot And Perpetual Trade Feeds Across On-Chain Markets
TL;DR: Dune has launched normalized real-time feeds for spot and perpetual DEX trades, designed to help institutional desks compar...
SoFi Launches Yield-Bearing Tokenized Bank Deposit With Stablecoin Conversion
TL;DR: SoFi says its new SOFIE tokenized deposit represents money held at SoFi Bank, advertises 4.40% APY subject to terms, and ca...

Bitcoin Is Busier Than Ever, but Bitcoin Mining Isn’t Getting Paid More
Bitcoin is processing more transactions than ever before on an annual basis, but the growing activity is doing little to improve o...

SEC clears listing of Volatility Shares’ 3x Bitcoin and Ether ETFs
The SEC's approval of 3x crypto ETFs could increase market volatility and attract speculative trading, impacting broader financial...
Bitcoin ETF Flows Trail Price Moves, DWF Study Finds
Bitcoin ETF flows track recent price moves more closely than subsequent ones, according to DWF Labs research published October 22....