TA: Bitcoin Price Forms Bullish Pattern, Why BTC Could Rally Above $20K
Bitcoin price is holding gains above the $19,000 level against the US Dollar. BTC could rally if there is a clear move above the $19,660 resistance zone. Bitcoin remained stable and consolidated above the $19,000 support...
Archive context
Older archive item. Useful for background and entity history, but not a fresh market-moving signal.

Bitcoin price is holding gains above the $19,000 level against the US Dollar. BTC could rally if there is a clear move above the $19,660 resistance zone.
- Bitcoin remained stable and consolidated above the $19,000 support zone.
- The price is trading above $19,100 and the 100 hourly simple moving average.
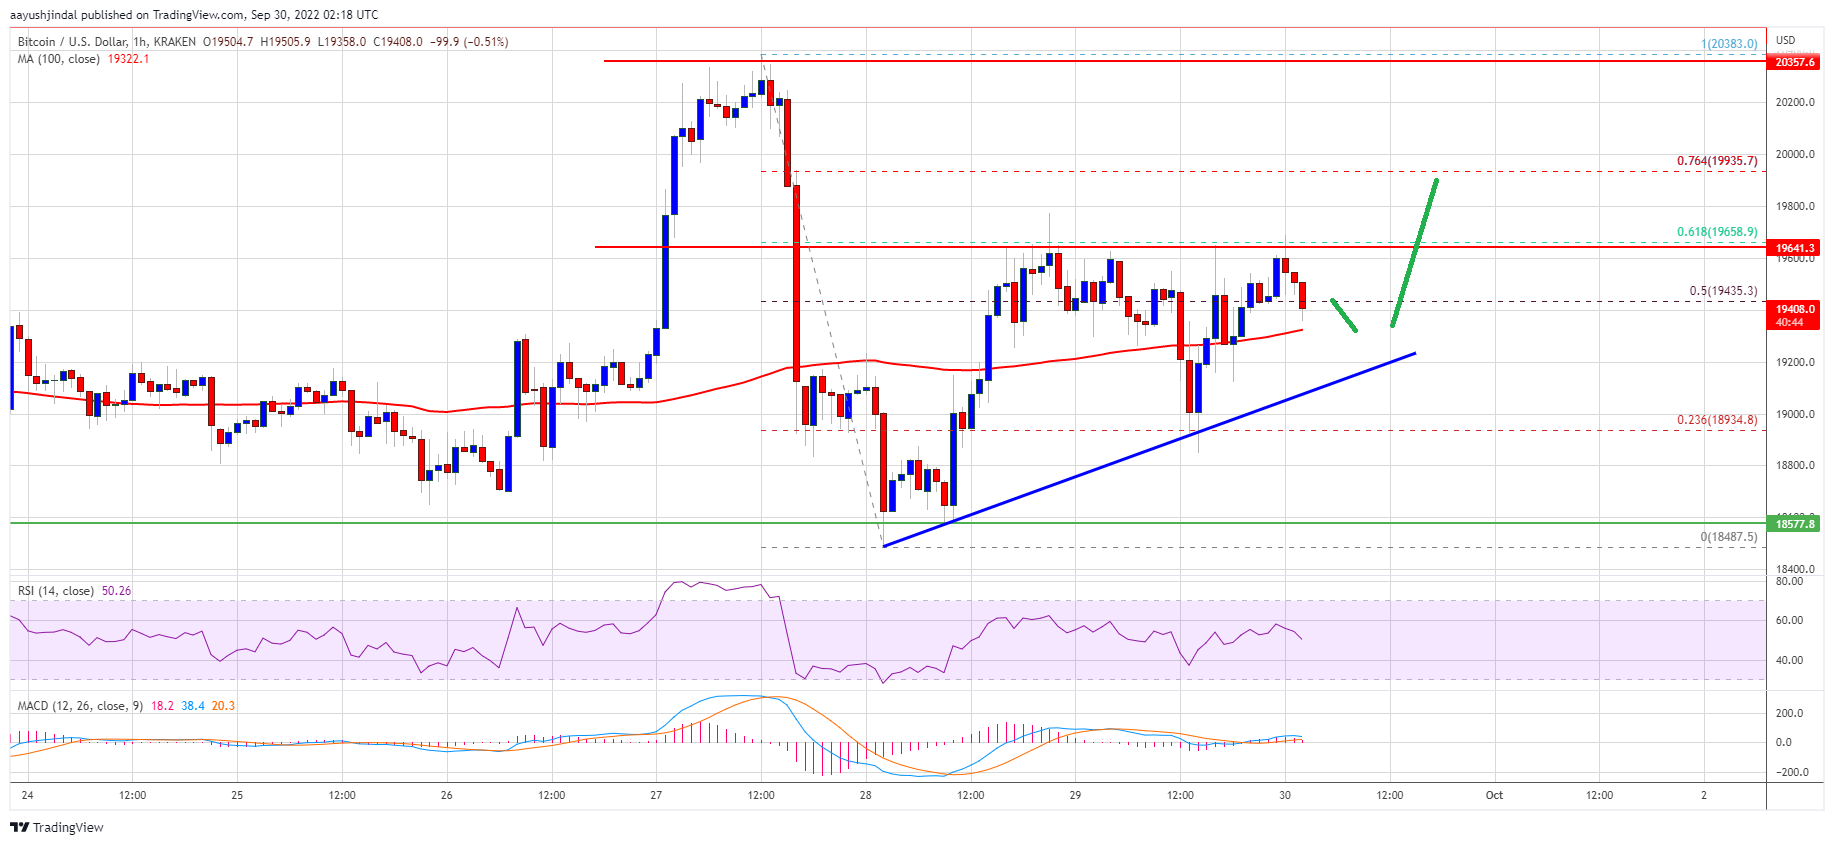
- There is a key bullish trend line forming with support near $19,220 on the hourly chart of the BTC/USD pair (data feed from Kraken).
- The pair could start a fresh surge if there is a clear move above the $19,660 resistance zone.
Bitcoin price started a recovery wave from the $18,500 support zone. BTC bulls remained active above the $18,500 level and managed to push the price above the $19,000 resistance zone.
There was a clear move above the 50% Fib retracement level of the key decline from the $20,382 swing high to $18,486 low. The price even climbed above the $19,500 resistance zone, but the bears were active near the $19,650 and $19,660 levels.
Bitcoin price is now consolidating above $19,100 and the 100 hourly simple moving average. There is also a key bullish trend line forming with support near $19,220 on the hourly chart of the BTC/USD pair.
On the upside, an immediate resistance is near the $19,500 level. The next major resistance sits near the $19,660 zone. It is close to the 61.8% Fib retracement level of the key decline from the $20,382 swing high to $18,486 low.
Source: BTCUSD on TradingView.com
A clear move above the $19,660 resistance might start a fresh increase. In the stated case, the price could even surpass the $20,000 resistance zone. The next major resistance is near the $20,500 zone, above which the price may perhaps revisit the $21,000 zone.
Another Drop in BTC?If bitcoin fails to rise above the $19,660 resistance zone, it could start a fresh decline. An immediate support on the downside is near the $19,350 zone and the 100 hourly SMA.
The next major support is near the $19,220 zone and the bullish trend line. The main support is near $19,000. Any more losses might call for a drop towards the $18,500 support zone in the coming sessions.
Technical indicators:
Hourly MACD – The MACD is now losing pace in the bullish zone.
Hourly RSI (Relative Strength Index) – The RSI for BTC/USD is now above the 50 level.
Major Support Levels – $19,220, followed by $19,000.
Major Resistance Levels – $19,660, $20,000 and $20,500.
Why this matters
This bitcoin story adds another data point to the current market tape and is useful when read alongside nearby source coverage.
Original source
Read on NewsBTCRelated market context

Crypto News, July 15: Bitcoin and Ethereum Price Jump on Softer CPI and Japan Bitcoin ETF
Bitcoin and Ethereum price climbed after cooler-than-expected U.S. inflation data improved market sentiment. Just hours after, a J...

Ethereum Research Thread Puts Sybil Resistance Back In Focus For Decentralized Networks
Ethereum Research Thread Puts Sybil Resistance Back In Focus For Decentralized Networks is a useful reminder that crypto coverage...

Ethereum Foundation Clear Signing Push Targets Crypto’s Blind Approval Problem
Ethereum Foundation Clear Signing Push Targets Crypto’s Blind Approval Problem is a useful reminder that crypto coverage is not on...

XRP’s $1 rebound faces holders trapped above $2
Glassnode reported that XRP holders who bought between 6 and 12 months ago have an average cost basis near $2.22, roughly 52% abov...

Bitcoin (BTC) Price Prediction: $65.6K Liquidity Sweep Could Decide Whether BTC Retests $60K or Breaks Higher
While short-term technical indicators suggest buyers are attempting to regain momentum, traders remain cautious as mixed signals a...

Ripple Joins x402 Foundation to Advance RLUSD AI Payments: Will XRP Price Benefit?
XRP price prediction is back in focus as it trades around $1.11, up about 3.6% over the past 24 hours. It remains pinned beneath a...