The Bitcoin Retracement Rally And The Resistance Level That Could End It All
Bitcoin saw its price retrace after initially moving upwards and clearing the resistance at $80,000. Eventually, though, the price ended up hitting major resistance at $82,000 and falling back downward. Now, the Bitcoin...
Archive context
Older archive item. Useful for background and entity history, but not a fresh market-moving signal.

Bitcoin saw its price retrace after initially moving upwards and clearing the resistance at $80,000. Eventually, though, the price ended up hitting major resistance at $82,000 and falling back downward. Now, the Bitcoin price seems to be stuck in a sideways movement that threatens to be the end of the recovery. However, this might not be the end of the bullish trend that is being flagged on the chart.
Why The Bitcoin Price Could Recover QuicklyIn a recent post, a pseudonymous crypto analyst who goes by HAMED_AZ highlighted three clear signals that could show that the bitcoin price is on the verge of a bullish reversal. The first of these is that the cryptocurrency has now entered a major demand zone.
This demand zone lies between $70,000 and $73,000, showing the levels where there has been the most support for the Bitcoin price in recent times. According to the crypto analyst, this demand zone has previously been a strong reaction zone and could continue in the same way.
Next on the line is the ascending trendline that has appeared on the Bitcoin chart. This ascending trendline has held recently and has supported the uptrend previously. If this trend continues to hold, then it is likely that the Bitcoin price will continue to rise.
Then, last but not least on the list is the fact that the 50% Fibonacci retracement. With the 0.5 Fibonacci level sitting just around $71,302, it means that the BTC price has not fallen toward the general area of this level, creating alignment.
Where Is The Price Headed?Following the analysis, the Bitcoin price could be looking at another upward recovery soon. However, just like before, there is still a lot of resistance lying in wait at the $82,000 level, meaning that this is the level to beat if bulls want to maintain the uptrend.
For the bearish case, the Bitcoin price would need to first break below the ascending trendline. This puts it below $71,000 at the current level, and if this happens, the crypto analyst says it would open the door for an even deeper correction for the cryptocurrency.
Why this matters
Bitcoin is a tracked market entity in the DigitalMoneyBox archive, making this useful context for readers monitoring repeated mentions and follow-up coverage.
Original source
Read on NewsBTCRelated market context

Bitcoin (BTC) Price Today: SOPR Turns Bullish as BTC Holds $81K, Eyes $83K-$86K Short Squeeze
Bitcoin price and market data show BTC trading around $81,300 at the latest update, with a 24-hour range between $77,968 and $81,6...
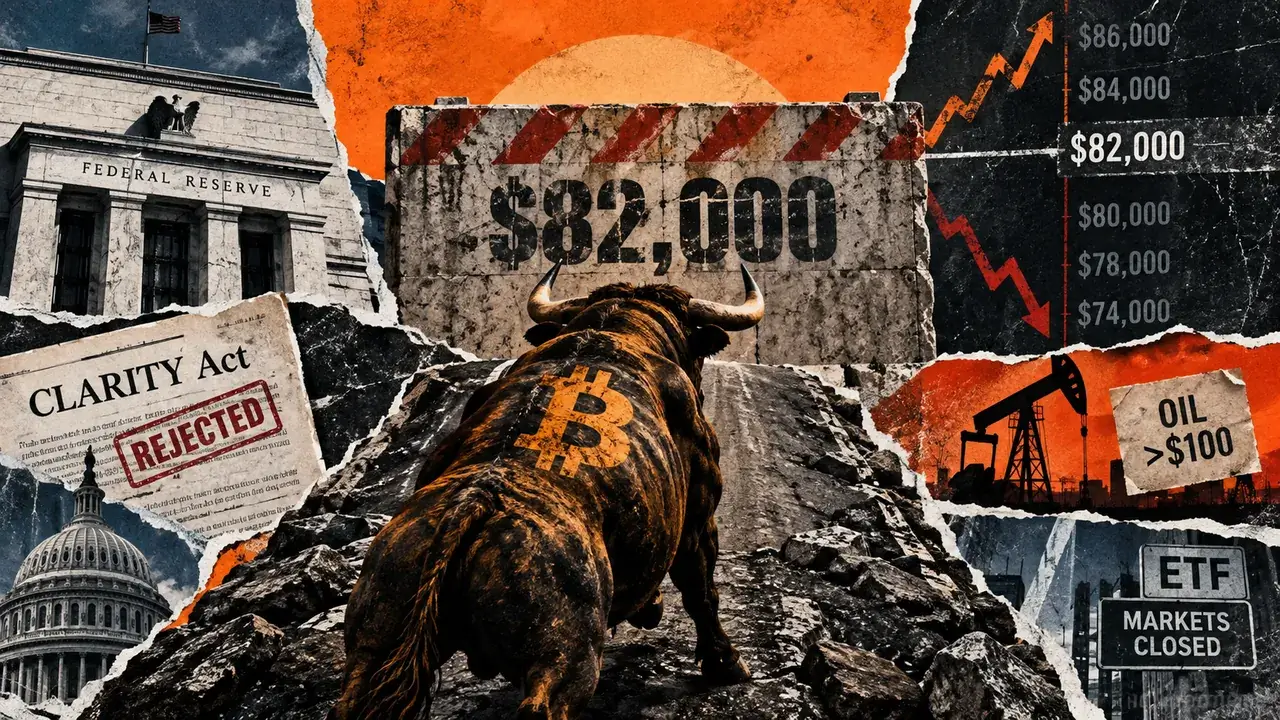
Bitcoin survived the Fed and CLARITY, and now faces the next major test at $82,000 this weekend
Bitcoin hit an intraday high of $81,400 on Friday, approaching the low-$82,000 zone that has capped every recovery attempt since l...

Ethereum (ETH) Price Prediction: $2,400 Support Holds as Bulls Eye $2,570 and $3,000
The latest recovery has pushed Ethereum price back towards $2,446 after buyers defended the important $2,400 support region. ETH p...

Google Gemini AI Predicts an Explosive End to 2026 for XRP
When prompted, Google Gemini AI predicts that under a full bull market structure between now and 2027, XRP could surge as high as...

XRP Price Prediction: Ripple Prints Most Bullish RSI Ratio Since Covid
XRP price trades at $1.32, clawing back ground after a brutal two-week stretch that saw it shed its value and prediction from the...

Mark Zuckerberg Meta AI Predicts Bitcoin to Hit $230,000
The Mark Zuckerberg Meta AI predicts Bitcoin could not only hit a new all-time high in 2026, but nearly double the $126,000 high f...