Tron Price Prediction: TRX Outperforms Bitcoin, Can It Hit $0.132?
Tron price is gaining pace above the $0.1220 resistance against the US Dollar. TRX is outperforming Bitcoin and could rise further above $0.1250. Tron is moving higher above the $0.120 resistance level against the US dol...
Archive context
Older archive item. Useful for background and entity history, but not a fresh market-moving signal.

Tron price is gaining pace above the $0.1220 resistance against the US Dollar. TRX is outperforming Bitcoin and could rise further above $0.1250.
- Tron is moving higher above the $0.120 resistance level against the US dollar.
- The price is trading above $0.1220 and the 100 simple moving average (4 hours).
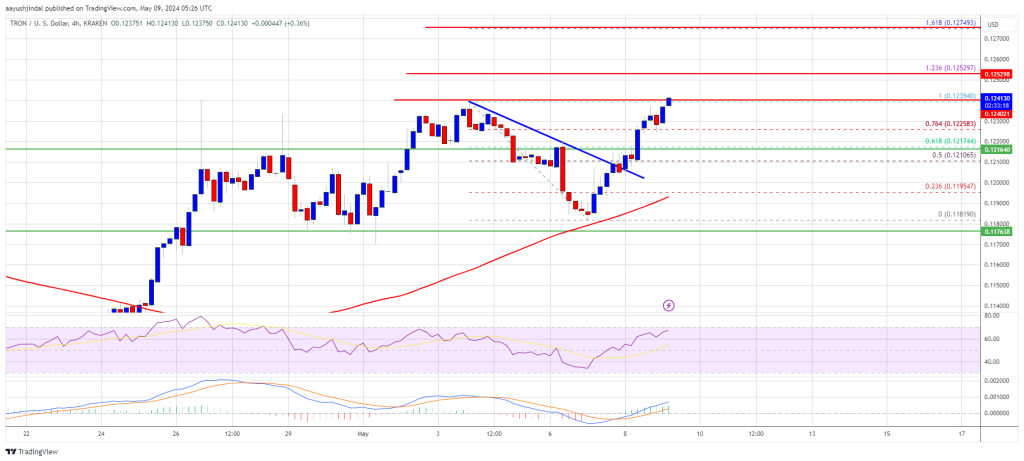
- There was a break above a key bearish trend line with resistance at $0.120 on the 4-hour chart of the TRX/USD pair (data source from Kraken).
- The pair could continue to climb higher toward $0.1275 or even $0.1320.
Recently, Bitcoin and Ethereum saw a fresh decline below $63,500 and $3,100 respectively. However, Tron price remained stable above the $0.1180 support and even climbed higher.
There was a decent move above the $0.120 resistance zone. TRX price cleared the 50% Fib retracement level of the downward move from the $0.1239 swing high to the $0.1181 low. Besides, there was a break above a key bearish trend line with resistance at $0.120 on the 4-hour chart of the TRX/USD pair.
Tron price is now trading above $0.1220 and the 100 simple moving average (4 hours). On the upside, an initial resistance is near the $0.1250 level.
Source: TRXUSD on TradingView.com
The first major resistance is near $0.1275 or the 1.618 Fib extension level of the downward move from the $0.1239 swing high to the $0.1181 low, above which the price could accelerate higher. The next resistance is near $0.1320. A close above the $0.1320 resistance might send TRX further higher toward $0.1365. The next major resistance is near the $0.140 level, above which the bulls are likely to aim for a larger increase toward $0.150.
Are Dips Supported in TRX?If TRX price fails to clear the $0.1250 resistance, it could start a downside correction. Initial support on the downside is near the $0.1220 zone.
The first major support is near the $0.1195 level or the 100 simple moving average (4 hours), below which it could test $0.1180. Any more losses might send Tron toward the $0.1150 support in the coming sessions.
Technical Indicators
4 hours MACD – The MACD for TRX/USD is gaining momentum in the bullish zone.
4 hours RSI (Relative Strength Index) – The RSI for TRX/USD is currently above the 50 level.
Major Support Levels – $0.1220, $0.1195, and $0.1180.
Major Resistance Levels – $0.1250, $0.1275, and $0.1320.
Why this matters
This bitcoin story adds another data point to the current market tape and is useful when read alongside nearby source coverage.
Original source
Read on NewsBTCRelated market context

XRP Price Prediction: XRP Faces Critical Resistance Near $1.17 Despite Ripple Securing Landmark EU License
While the company secured a full MiCA license that expands its operations across the European Economic Area, market indicators sug...

Bitcoin price rebounds to $63K as leverage returns creating short term volatility risk
Bitcoin's rebound has cleared the first test: price recovered. The harder one starts now: proving buyers remain after the squeeze....

Sam Altman ChatGPT AI Predicts Insane Bitcoin Price by 2026
Sam Altman ChatGPT AI just circled November on the calendar and put a number next to Bitcoin Price Prediction. The model predicts...

Elon Musk Grok AI Predicts Incredible XRP Price Target by End of 2026
Elon Musk Grok AI just published what might be the most partnership-heavy XRP price prediction in this entire series. The model pr...
Solana’s $8.7B RWA surge shows tokenized assets are finally starting to move
Solana’s real-world asset transfer volume more than doubled over the past month, giving the network a stronger signal that tokeniz...

BitGo launches electronic trading in Dubai, deepening its institutional crypto push across MENA
BitGo's expansion in Dubai could catalyze a shift towards integrated crypto services in MENA, enhancing institutional market effic...