WATCH: Powell Versus Bitcoin Price Log Curve | Daily TA August 26, 2022
In this episode of NewsBTC’s all-new daily technical analysis videos, we are looking at the Bitcoin logarithmic growth curve, the Power Law Corridor, and the 200/100/50-week moving averages. Take a look at the video belo...
Archive context
Older archive item. Useful for background and entity history, but not a fresh market-moving signal.

In this episode of NewsBTC’s all-new daily technical analysis videos, we are looking at the Bitcoin logarithmic growth curve, the Power Law Corridor, and the 200/100/50-week moving averages.
Take a look at the video below.
VIDEO: Bitcoin Price Analysis (BTCUSD): August 26, 2022US Fed Reserve Chair Jerome Powell’s speech today is already having an impact on markets, with Bitcoin losing support at $21,000 and in danger of falling deeper into a bear trend. With the crypto market in doubt, in this video we zoomed out.
Log Growth Curve Continues To Support Price ActionIn this zoomed out view we are taking a closer look at the Bitcoin logarithmic growth curve. A logarithmic growth curve increases quickly at the start but gains decrease and become more difficult over time. The log growth curve is closely tied to the law of diminishing returns.
This type of early growth forms naturally. For example, children learn more easily than adults; when dieting, weight comes off faster to start; or in contrast, beginner strength training gains stack up quickly but over time plateau.
The log growth curve has supported the entire history of Bitcoin price action and put a stop to every bull market. On Black Thursday in March 2020 and on August 20 2015 Bitcoin left a wick below the log growth curve. Each time resulted in a powerful bull run. According to legendary investor Sir John Templeton, “The four most dangerous words in investing are, this time its different” Is this time really different?
The log curve has never been broken | Source: BTCUSD on TradingView.com Power Law Corridor Offers Alternative Take With Lower Support
Some might argue that the log curve is subjective – it is. In the video, we’ve chosen to draw the curve across candle closes allowing a wick below. Slightly adjusting to draw across wicks creates more room at the bottom of the curve.
There is yet another longer-term growth model, called the Bitcoin Power Law Corridor that is less subjective overall. Turning the tool on aligns with both versions of the log curve. The 2018 bear market bottom stopped at the same line we are at now, while the Black Thursday bottom in 2020 fell to the level below.
Bulls could be ready to power-up! | Source: BTCUSD on TradingView.com A Long-Term Look At The 200/100/50-Week MAFor our final long-term look at Bitcoin, we are analyzing the 200, 100, and 50-week moving averages. Unfortunately, Bitcoin remains below the 200-week moving average which is a negative sign. The moving average has acted as bear market bottom support in the past and could be working as resistance currently. The 100- and 50-week moving averages are also about to form a death cross – which is the reason for calling out this tool.
In the past when the 100 and 50 week moving averages cross in Bitcoin, the bottom was already in, and the crypto market began to move up shortly thereafter. Once again, is this time different?
Is this time different? | Source: BTCUSD on TradingView.comLearn crypto technical analysis yourself with the NewsBTC Trading Course. Click here to access the free educational program.
All this week at Elliott Wave International is Trader Education Week. Here is free access to five exclusive videos from one of the world’s best Elliott Wave analysts. You can also get the Elliott Wave book for free with a no cost signup.
Follow @TonySpilotroBTC on Twitter or join the TonyTradesBTC Telegram for exclusive daily market insights and technical analysis education. Please note: Content is educational and should not be considered investment advice.
Featured image from iStockPhoto, Charts from TradingView.comWhy this matters
This bitcoin story adds another data point to the current market tape and is useful when read alongside nearby source coverage.
Original source
Read on NewsBTCRelated market context
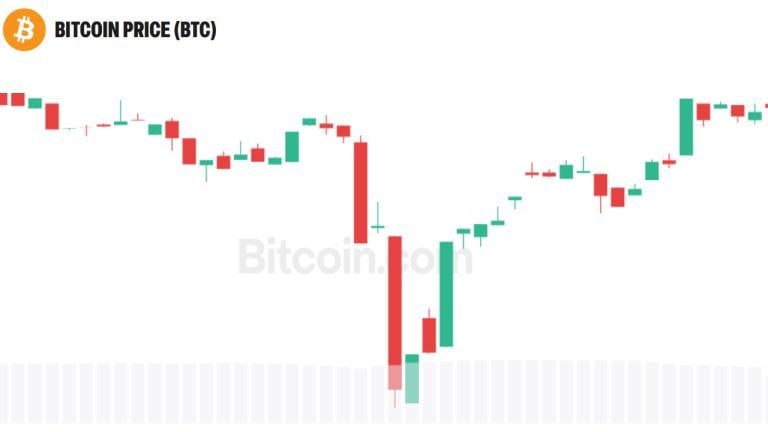
Peter Schiff Warns Bitcoin Could Hit $75K After BTC Fell Below $80K
Peter Schiff sees $75K as bitcoin’s next likely stop after its drop below $80K. The warning follows his concerns about weakening t...
Bitcoin’s Fed Week Starts With A Fresh Rise In US Inflation Expectations
TL;DR: US household inflation expectations rose in October while consumer sentiment barely changed. The readings add context ahead...
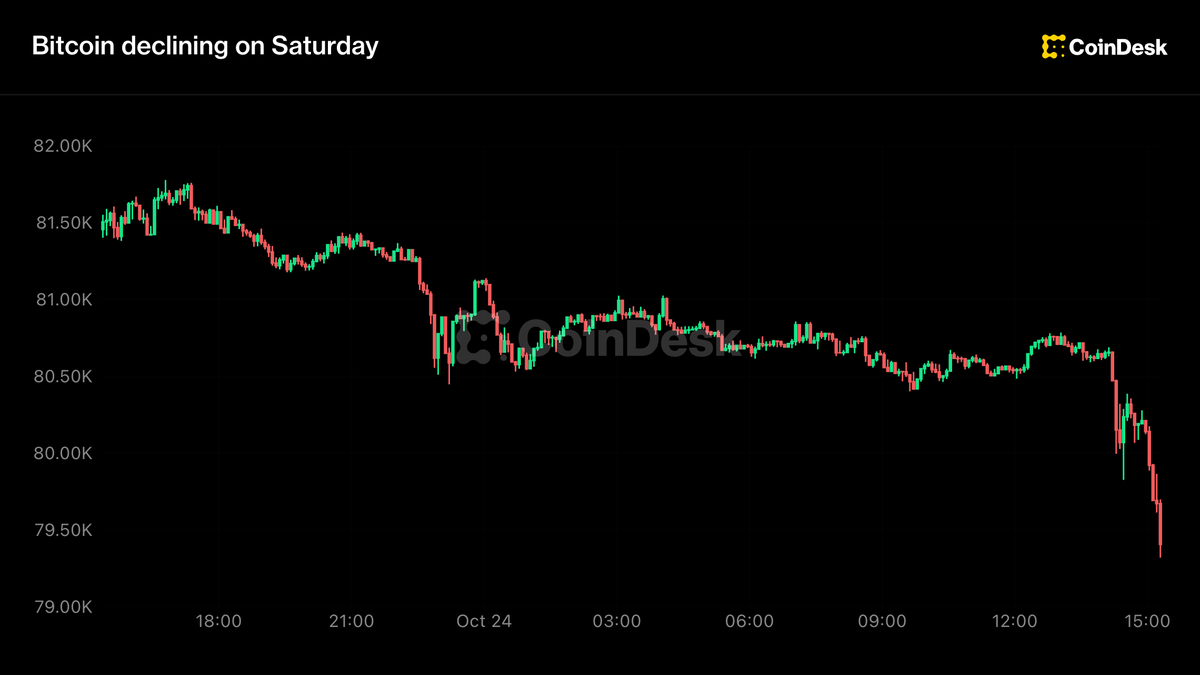
Crypto under weekend pressure, bitcoin slides below $80,000 on U.S. Middle East evacuations
Bitcoin has sunk to its weakest level in more than one month.
Dune Adds Real-Time Spot And Perpetual Trade Feeds Across On-Chain Markets
TL;DR: Dune has launched normalized real-time feeds for spot and perpetual DEX trades, designed to help institutional desks compar...

Grayscale Looks Beyond AI Tokens To The Data And Credit Behind Computing
Grayscale’s October 23 research note looks at a more specific crypto-and-AI proposition than a general bet on smarter software: wh...

Polymarket Fires CMO After Fake-Trade Probe,
Key Takeaways: Polymarket said it has terminated its Chief Marketing Officer, Matthew Modabber, following an internal investigatio...