Why The Bitcoin Price Could Mark A Generational Bottom And Rise Over 200%
Bitcoin’s investor sentiment is in ruins, but buried inside the wreckage, a technical signal that has appeared only at the most consequential turning points in Bitcoin’s history has just fired again. This technical argum...
Archive context
Older archive item. Useful for background and entity history, but not a fresh market-moving signal.

Bitcoin’s investor sentiment is in ruins, but buried inside the wreckage, a technical signal that has appeared only at the most consequential turning points in Bitcoin’s history has just fired again. This technical argument, which is built around Bitcoin’s Relative Strength Index, is because the indicator has fallen to its lowest daily reading in four years, a level last seen near the 2022 bottom before BTC began its climb from $15,500 to $70,000.
Bitcoin’s RSI Is Back In A Rare Bottom ZoneThe Relative Strength Index is among the most used momentum indicators, measuring the speed and magnitude of price movements on a scale from 0 to 100. Readings below 30 indicate oversold conditions. At its lowest point during the recent selloff over the weekend, the daily RSI fell to as low as 21.8, and the reading is still around the mid-20s at the time of writing.
That places this reading among the lowest on record for the daily timeframe, and that is why a crypto analyst that goes by the name Crypto Tice on the social media platform believes the Bitcoin price action may be looking at something much bigger than a normal oversold bounce.
As shown in the chart below, the red and orange zones line up with some of Bitcoin’s most painful periods, including the 2011 bottom, the 2015 bear-market low, the 2018-2019 correction, the 2022 collapse, and now the 2026 slow correction. In each case, the bottom appeared when the Bitcoin price had already endured a major decline, and that is the same setup happening right now.
Bitcoin Price Chart. Source: @CryptoTice_ On X
Why A 200% Target Is Possible For BitcoinBitcoin fell below $60,000 for the first time since 2024 and is currently down by about 50% from its October 2025 peak above $126,000. The leading cryptocurrency is now trading between $61,000 and $63,000.
Interestingly, the main comparison of where Bitcoin goes from here is the 2022 bottom. Back then, Bitcoin’s RSI reached deeply oversold levels as the price collapsed to around $15,500, but the low eventually became the base for a rally to $70,000 in 2024. That move represented a gain of more than 350% from the cycle bottom, and it eventually rolled on to its all-time high in October 2025.
If Bitcoin were to form a similar bottom around the current $60,000 zone, a 200% rally would place the price at a target of $180,000. A move matching the full 2022-to-2024 recovery would imply even higher levels above $200,000. The present market also has a different background from 2022. Bitcoin now has spot ETFs, deeper institutional involvement, and large corporate holders that are influencing sentiment.
Speaking of ETFs, Spot Bitcoin ETFs have resumed their streak of outflows, which complicates any bottom prediction right now. The technical signal from the RSI is strong, but the Bitcoin price needs demand to turn the signal into a sustained rally.
Why this matters
Bitcoin is a tracked market entity in the DigitalMoneyBox archive, making this useful context for readers monitoring repeated mentions and follow-up coverage.
Original source
Read on NewsBTCRelated market context

XRP Price Prediction: Ripple Prints Most Bullish RSI Ratio Since Covid
XRP price trades at $1.32, clawing back ground after a brutal two-week stretch that saw it shed its value and prediction from the...
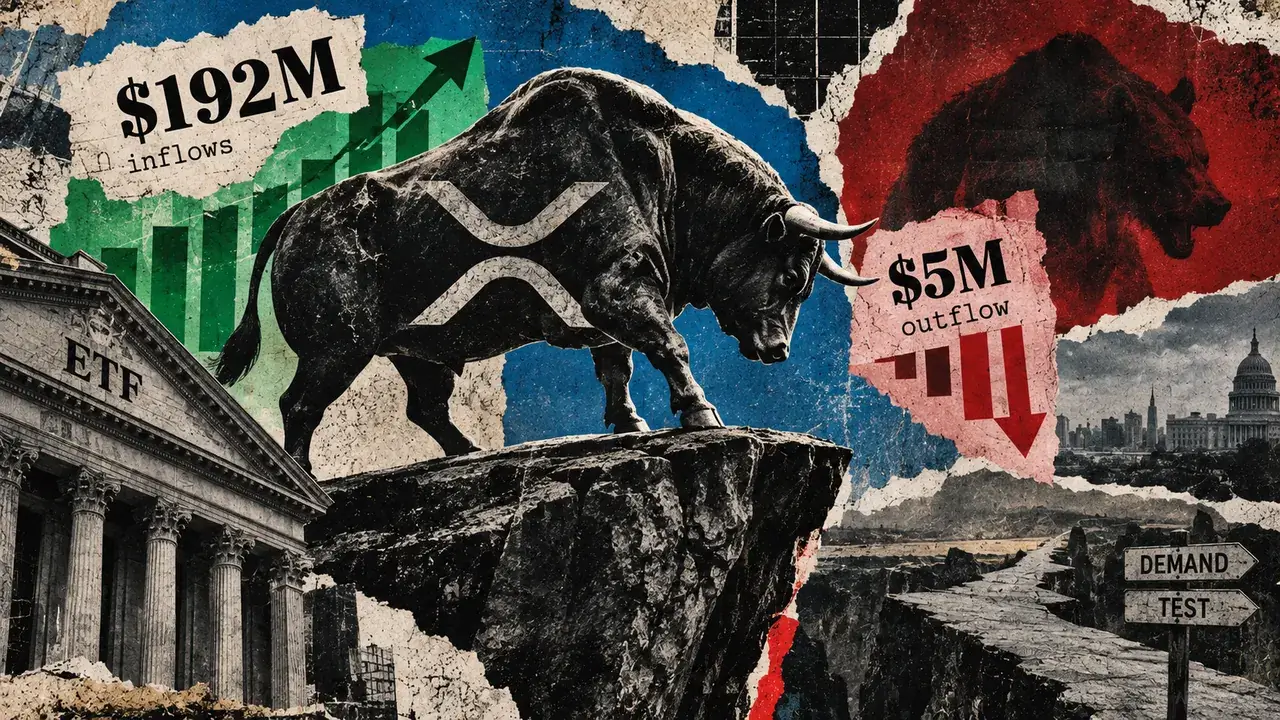
XRP ETFs hit a speed bump, but big investors aren’t dumping their tokens yet
A roughly $5.15 million outflow from US spot XRP exchange-traded products on Sept. 17 interrupted a $192 million inflow month. The...

XRP News: 16-Cross History Complicates the Golden Cross Signal
XRP should be in every news headline as its 50-day moving average sits about 2% below its 200-day average, the closest the gap has...

XRP Price Holds Above $1.29 as Futures Leverage Resets
XRP price trades near $1.30, going up by as little as 1%, even as open interest across its derivatives market has fallen from $1.1...
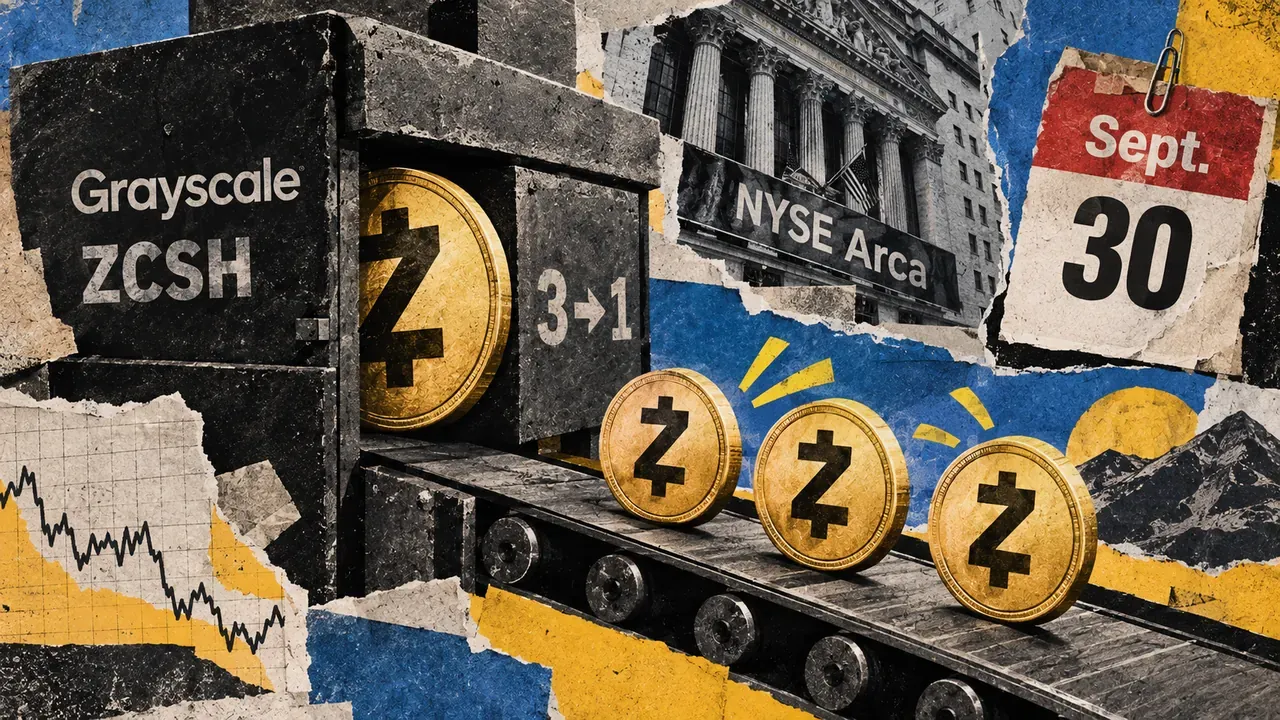
ZEC’s 100% rally above $1500 sends Grayscale’s Zcash ETF within $85 million of $1 billion
Grayscale’s Zcash ETF is closing in on $1 billion in assets less than a month after its Wall Street debut. The fund, which trades...

Bitcoin (BTC) Price Today: SOPR Turns Bullish as BTC Holds $81K, Eyes $83K-$86K Short Squeeze
Bitcoin price and market data show BTC trading around $81,300 at the latest update, with a 24-hour range between $77,968 and $81,6...