AAVE Price Prediction: Surges 20% This Week, Rally Could Extend Above $85
AAVE price started a major increase from the $65 support zone. It is up nearly 20% this week and might extend gains above the $85 resistance. AAVE price gained pace after it surpassed the $75 resistance against the US do...

AAVE price started a major increase from the $65 support zone. It is up nearly 20% this week and might extend gains above the $85 resistance.
- AAVE price gained pace after it surpassed the $75 resistance against the US dollar.
- The price is trading below $85 and the 100-day simple moving average.
- There was a break above a major bearish trend line with resistance at $75 on the daily chart of the AAVE/USD pair (data source from Kraken).
- The pair could continue to rise and might soon test the $100 resistance zone.
After a steady decline, AAVE price found support near the $65 zone. The price formed a base above the $65 level and started a steady increase.
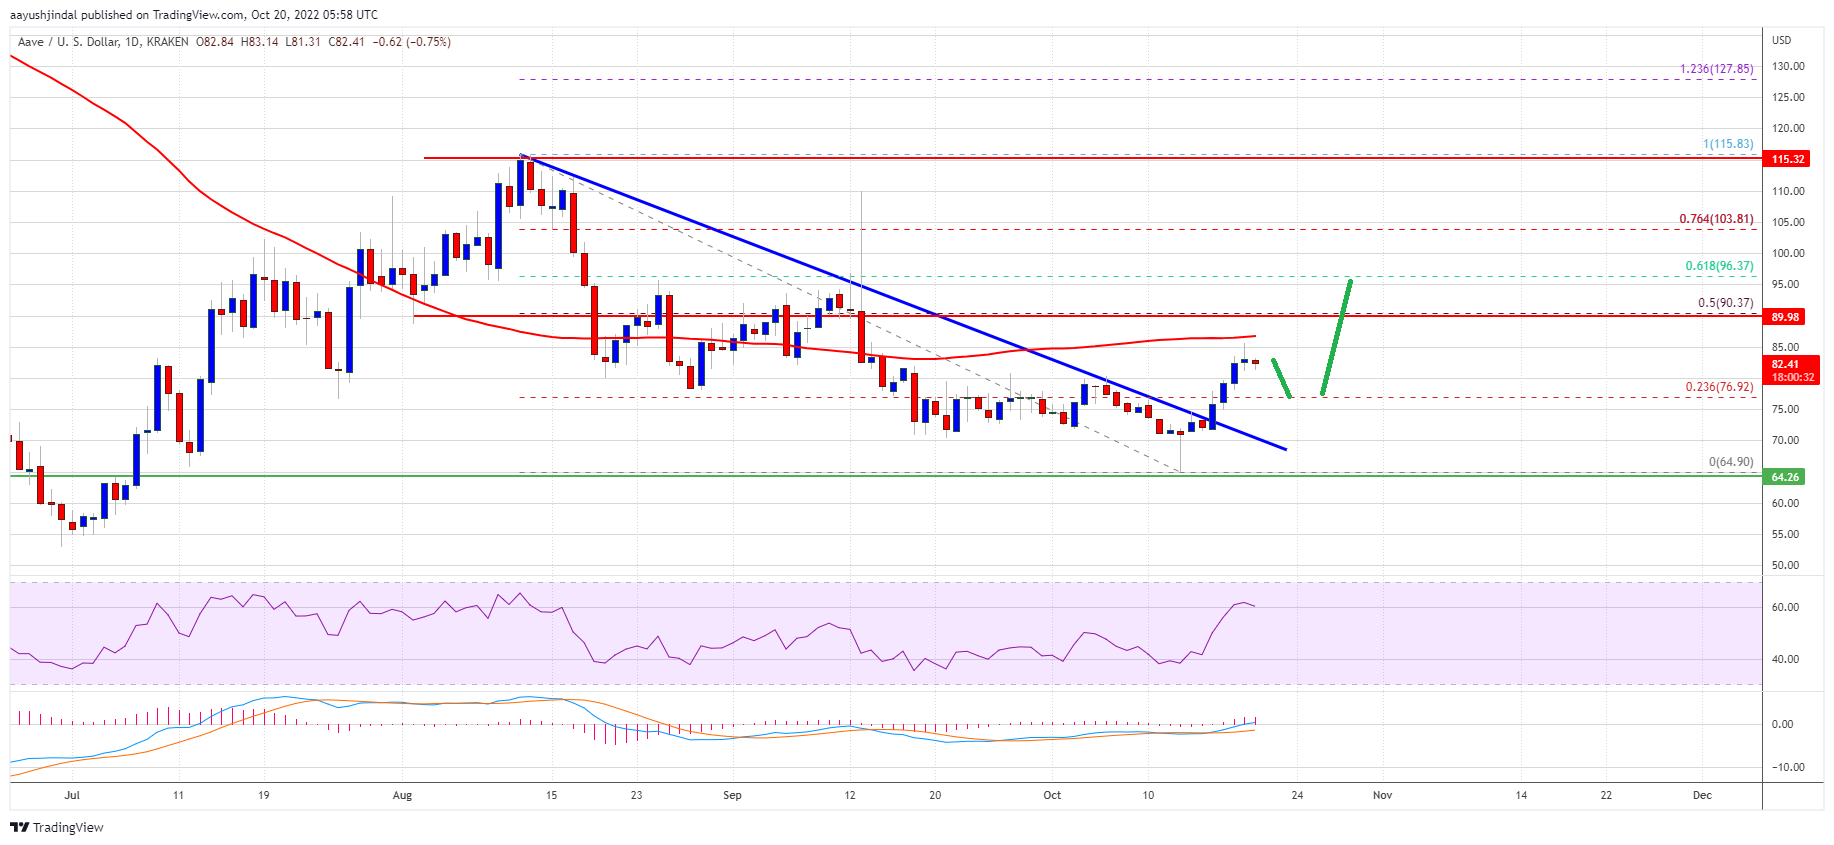
There was a clear move above the $72 and $75 resistance levels. The price climbed above the 23.6% Fib retracement level of the downward move from the $116 swing high to $65 low. Besides, there was a break above a major bearish trend line with resistance at $75 on the daily chart of the AAVE/USD pair.
The price is now trading near the $85 resistance and the 100-day simple moving average. It is also showing positive signs, outperforming bitcoin and ethereum.
Source: AAVEUSD on TradingView.com
On the upside, an immediate resistance is near the $85 zone. The next major resistance is forming near the $90 zone. It is close to the 50% Fib retracement level of the downward move from the $116 swing high to $65 low. If there is an upside break above the $95 and $100 levels, the price could surge over 10%. In the stated case, the price could rise steadily towards the $100 level.
Dips Limited in AAVE?If AAVE price fails to continue higher above the $85 or $90 levels, it could start a downside correction. An immediate support on the downside is near the $80 level.
The main support is near the $75 zone. A downside break below the $75 level could open the doors for a fresh decline towards $70. The next major support is near the $65 level.
Technical Indicators
Daily MACD – The MACD for AAVE/USD is slowly losing momentum in the bullish zone.
Daily RSI (Relative Strength Index) – The RSI for AAVE/USD is now above the 50 level.
Major Support Levels – $80 and $75.
Major Resistance Levels – $85, $90 and $100.
Original source
Read on NewsBTCRelated market context

Bitcoin price challenges $64,000 weekend wall – needing a breakout or risk a deeper correction
Bitcoin reclaimed $64,000 on June 12 and touched an intraday high of $64,301 in the same session that spot ETF flows finally flipp...

XRP Price Prediction: Japan XRP ETF Listing is Getting Closer
Japan just handed XRP bulls a major regulatory tailwind. XRP price is retesting a congestion zone, and the prediction could turn b...

Standard Chartered Says Bitcoin Bottomed Near $59,000 As Crypto Winter Ends
TL;DR Standard Chartered’s Geoffrey Kendrick reportedly says Bitcoin’s $59,000 area marked the cycle bottom. The note cites SpaceX...

Bitcoin price faces new risk as big buyers lose conviction
Bitcoin’s largest buyers are no longer behaving like a reliable backstop for the largest cryptocurrency. The exchange-traded funds...

Google Gemini AI Predicts Jaw-Dropping XRP Price For Next 90 Days
Google Gemini AI just put XRP back under the spotlight, predicting it is tightly wound for a major breakout toward $1.60 to $1.80...

Elon Musk SpaceX AI Predicts Incredible Bitcoin Price For Next 30 Days
Here is the thing about capitulation calls. They only sound smart in hindsight. Right now, with Bitcoin price scraping along the l...