Binance Coin Struggles Below $290 Resistance, Where Would Price Go?
Binance Coin (BNB) struggles to hold support after flipping it into resistance against tether (USDT) as a bullish structure hits a rock. Despite showing a great bullish structure in recent weeks, the price of Binance Coi...
Archive context
Older archive item. Useful for background and entity history, but not a fresh market-moving signal.

Binance Coin (BNB) struggles to hold support after flipping it into resistance against tether (USDT) as a bullish structure hits a rock. Despite showing a great bullish structure in recent weeks, the price of Binance Coin (BNB) has had a really quiet time as the market continues in a mist of mixed feelings regarding where the crypto market is headed. (Data from Binance)
Binance Coin (BNB) Token Price Analysis On The Weekly Chart Weekly BNB Price Chart | Source: BNBUSDT On Tradingview.comBNB saw a decline in its price from $650 to around $200, with an over 60% drop from its all-time high despite having good fundamentals. The price of BNB bounced off after touching a weekly low of $200, and the price rallied to $330, showing some great strength.
The price of BNB on the weekly chart formed an uptrend after bouncing from its weekly low with so much bullish sentiment as the price rallied to $330, where it faced a major weekly resistance to trend higher.
BNB’s price failed to break above this resistance on the weekly chart as the price was rejected but continued to respect the trendline support it has built in recent weeks after creating swing highs with good buy order volume.
The price of BNB is $276.1 on the weekly chart, trading a bit below the trendline support; if the price of BNB fails to hold this trendline support and the weekly price closes below this level or zone, we could see the price of BNB going its support level of $230.
For BNB’s price to maintain its bullish structure, the price of BNB needs to reclaim its trendline support and rally towards the resistance at $330, with good buy order volume for BNB.
Weekly resistance for the price of BNB – $330.
Weekly support for the price of BNB – $260.
Price Analysis Of BNB On The Daily (1D) Chart Daily BNB Price Chart | Source: BNBUSDT On Tradingview.comThe daily timeframe for BNB prices continues to weaken as the price broke out below the symmetric triangle BNB price has formed, losing its uptrend support on the daily timeframe.
The price of BNB needs to rally with good volume to assume its bullish structure in the daily chart as there are more sell orders for BNB presently.
On the daily timeframe, the price of BNB is currently trading at $276.1, as the price of BNB on the daily chart closed below the 50 and 200 Exponential Moving Average (EMA), acting as resistances for BNB price. The price of $285 and $317 corresponds to the resistance at 50 and 200 EMA for the price of BNB.
If the 50 EMA fails to be reclaimed by the BNB price, we could see the price retesting the support at $260 or lower.
The Relative Strength Index (RSI) for BNB is above 50 on the daily chart, indicating low buy order volume.
Daily resistance for the BNB price – $285-$317.
Daily support for the BNB price – $260-$230.
Featured Image From zipmex, Charts From TradingviewWhy this matters
This cryptocurrency story adds another data point to the current market tape and is useful when read alongside nearby source coverage.
Original source
Read on NewsBTCRelated market context

Elon Musk’s Grok AI Predicts When Bitcoin Will Finally Hit its Ultimate Price Target
X and SpaceX CEO Elon Musk’s Grok AI predicts something potentially historic could be brewing for Bitcoin by January 1, 2027. This...

Strategy’s Weekly STRC Buyback Climbs to $205 Million While Its Bitcoin Stack Stays Put
Strategy spent $204.9 million repurchasing 2,068,459 shares of its STRC preferred stock between Oct. 19 and Oct. 25 and bought no...

Bitcoin Slides Below $80,000 as AI Stock Selloff Bleeds Into Crypto
Bitcoin fell below $80,000 as AI stock worries and Fed uncertainty triggered $772 million in ETF outflows. What comes next for cry...
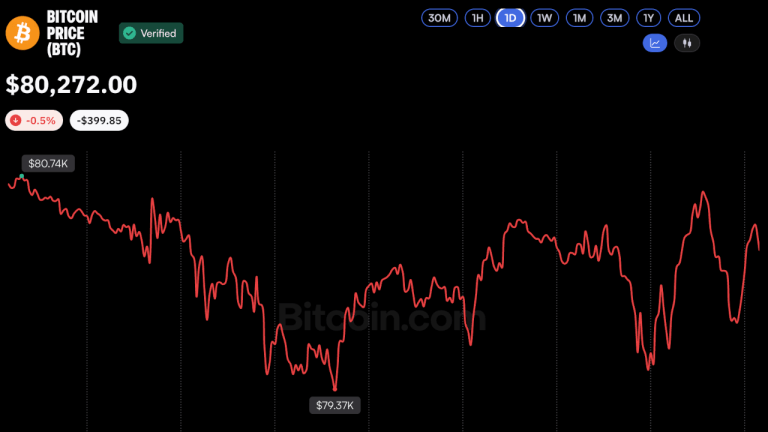
Bitcoin Price Struggles at $80K, but MEXC CEO Sees Bullish Signals
Bitcoin’s price reclaimed the $80,000 level twice on Monday, hovering near $80,100 amid rangebound trading between $79,500 and $80...

How Solana Supports Fast Crypto Payments in Digital Gaming
Picture a SOL holder on a quiet evening, watching the token tick sideways on a chart that hasn’t done much all week. Rather than r...

Bitcoin’s Bear Market Is Over, Galaxy Says
Bitcoin Magazine Bitcoin’s Bear Market Is Over, Galaxy Says Galaxy Research believes bitcoin’s bear market ended in June and that...