Binance Inflows A Leading Indicator For Altcoins? Analyst Explains How
A quant has explained how altcoin inflows into cryptocurrency exchange Binance might act as a leading indicator for the market. Spikes In Binance Altcoin Inflows Tend To Precede Corrections In a CryptoQuant Quicktake pos...
Archive context
Older archive item. Useful for background and entity history, but not a fresh market-moving signal.
A quant has explained how altcoin inflows into cryptocurrency exchange Binance might act as a leading indicator for the market.
Spikes In Binance Altcoin Inflows Tend To Precede CorrectionsIn a CryptoQuant Quicktake post, an analyst has talked about the trend in the altcoin exchange inflows going to Binance. The indicator of relevance here is the “Exchange Inflow Transaction Count,” which measures, as its name suggests, the total number of deposit transactions that investors are making to a given centralized exchange.
Below is a chart for the indicator that shows the trend in the altcoin deposits occurring on the various exchanges.
As is visible in the graph, the altcoin Exchange Inflow Transaction Count peaked on all exchanges right before both the 2024 market tops, implying that deposit activity intensified on the platforms. Generally, investors transfer their coins to exchanges when they want to sell, so spikes in exchange inflows can lead into bearish price action. This appears to be what happened in these two instances.
Interestingly, during the latest market drawdown that has occurred over the past few days, inflows on only one exchange have seen a spike: Binance. There have also been other instances in the past where this pattern developed. “Spikes in Binance inflows (represented by the purple area) frequently precede downward price movements or market corrections,” notes the analyst.
The quant has also explained that Binance is not only the largest exchange in the sector in terms of trading volume, but also a hub for altcoin activity from both retail and institutional entities. As such, investor behavior on the platform can be quite relevant for the wider market.
Speaking of alts, CryptoQuant has shared a few new indicators that can be used to track smart money. One of these is the Average Order Size, which differentiates between futures buy orders by their scale.
The above chart shows the indicator’s data for Hyperliquid (HYPE). It would appear that whale-sized buy orders appeared when the altcoin was trading around $11 earlier in the year. Since then, its price has climbed to $39.
Another indicator is the Retail Activity Through Trading Frequency. This one is the opposite: it points out periods of elevated activity from the small hands.
From this graph, it’s apparent that overheated periods of retail interest coincided with price highs in Gala (GALA).
ETH PriceAt the time of writing, Ethereum is trading around $3,600, down more than 4% over the past week.
Why this matters
This cryptocurrency story adds another data point to the current market tape and is useful when read alongside nearby source coverage.
Original source
Read on NewsBTCRelated market context
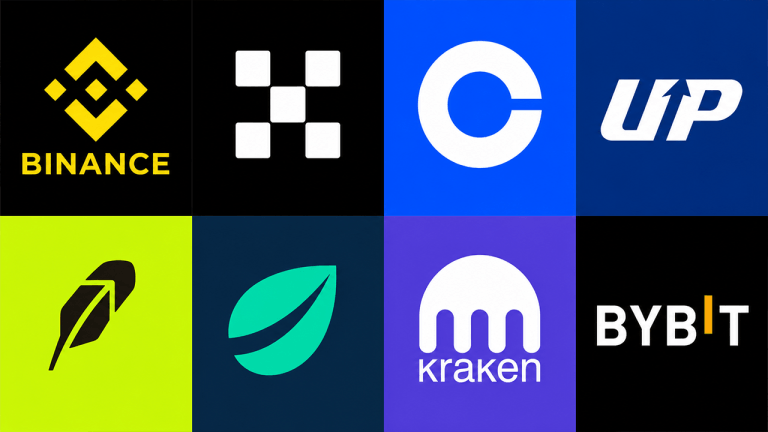
The Top 8 Crypto Exchanges by Reserves; Binance Holds a $130.1B War Chest
Binance controls more crypto than any other exchange currently operating on earth, holding $130.1 billion in digital assets tracke...
SEC targets crypto exchanges and broker dealers in new rule agenda
The SECs 2026 regulatory agenda includes proposed crypto market structure rules and broker dealer updates for crypto assets. The p...

SEC plans crypto rule changes for exchanges and broker dealers in 2026 regulatory agenda
The SEC is laying the groundwork for cryptocurrency rule changes before the end of the year, with a blueprint for exchanges and br...
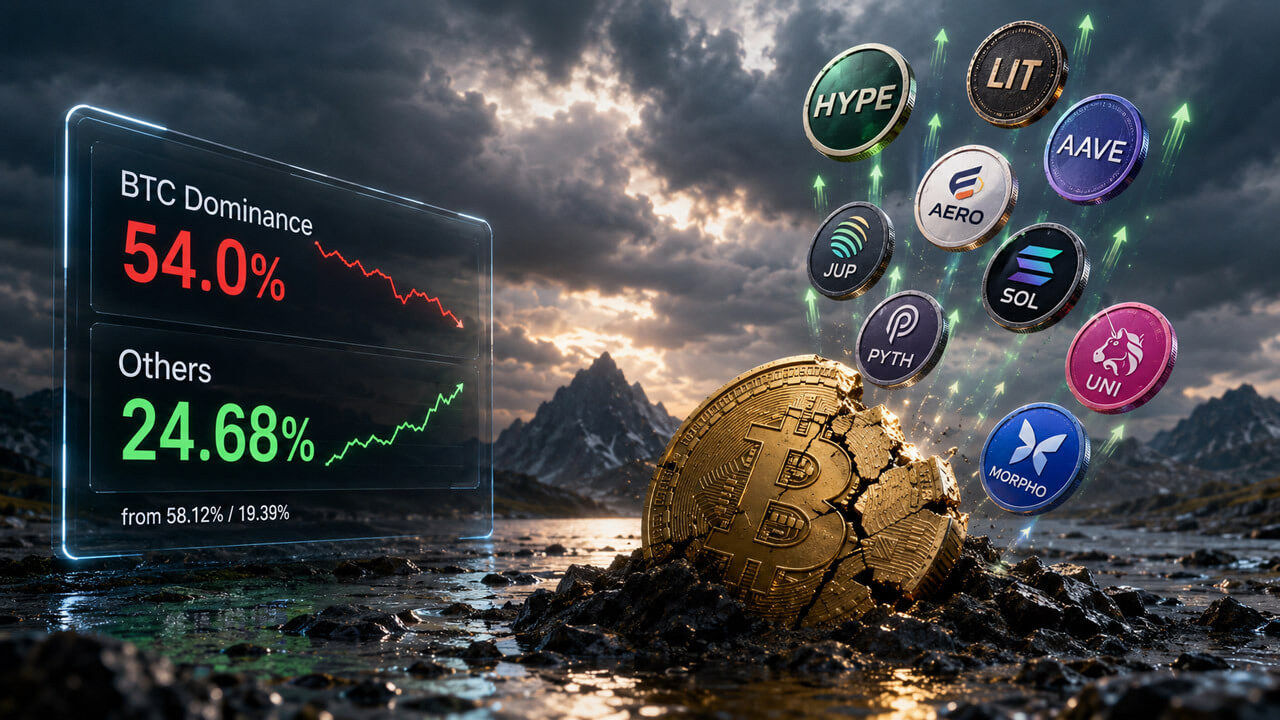
Bitcoin dominance hits one-month low as altcoin winners start breaking away
Bitcoin's dominance dropped to a one-month low of 54%, down from 58.12%, according to CoinGecko's dominance table. Over the same s...

Argentina vs Egypt World Cup match fuels crypto fan token trading and prediction market activity
The surge in fan token trading and prediction markets highlights crypto's growing role in sports, potentially boosting broader cry...

Nigeria Opens Antitrust Probe Into Big Tech, Raising Questions For Crypto Exchanges Operating In Africa’s Largest Market
Nigeria's President Tinubu orders antitrust investigation into major technology firms, raising compliance questions for crypto exc...