DOT Price (Polkadot) Uptrend To Continue? These Could Be The Factors To Watch
Polkadot (DOT) is gaining pace above the $6.80 resistance against the US Dollar. The price could gain bullish momentum if it clears the $7.28 resistance. DOT is trading in a positive zone from the $6.00 support against t...
Archive context
Older archive item. Useful for background and entity history, but not a fresh market-moving signal.

Polkadot (DOT) is gaining pace above the $6.80 resistance against the US Dollar. The price could gain bullish momentum if it clears the $7.28 resistance.
- DOT is trading in a positive zone from the $6.00 support against the US Dollar.
- The price is trading near the $7.00 zone and the 100 simple moving average (4 hours).
- There was a break above a key bearish trend line with resistance near $6.50 on the 4-hour chart of the DOT/USD pair (data source from Kraken).
- The pair could continue to rise unless the bears are able to defend the $7.28 resistance zone.
After a steady decline, DOT price found support near the $6.00 zone. A low was formed at $5.97 and Polkadot recently started a fresh increase. The price was able to clear the $6.20 and $6.50 resistance levels to move into a positive zone, like Bitcoin and Ethereum.
There was a break above a key bearish trend line with resistance near $6.50 on the 4-hour chart of the DOT/USD pair. The pair even surpassed the 23.6% Fib retracement level of the downward move from the $8.58 swing high to the $5.97 low.
DOT is now trading near the $7.00 zone and the 100 simple moving average (4 hours). Immediate resistance is near the $7.20 level. The next major resistance is near $7.28 or the 50% Fib retracement level of the downward move from the $8.58 swing high to the $5.97 low.
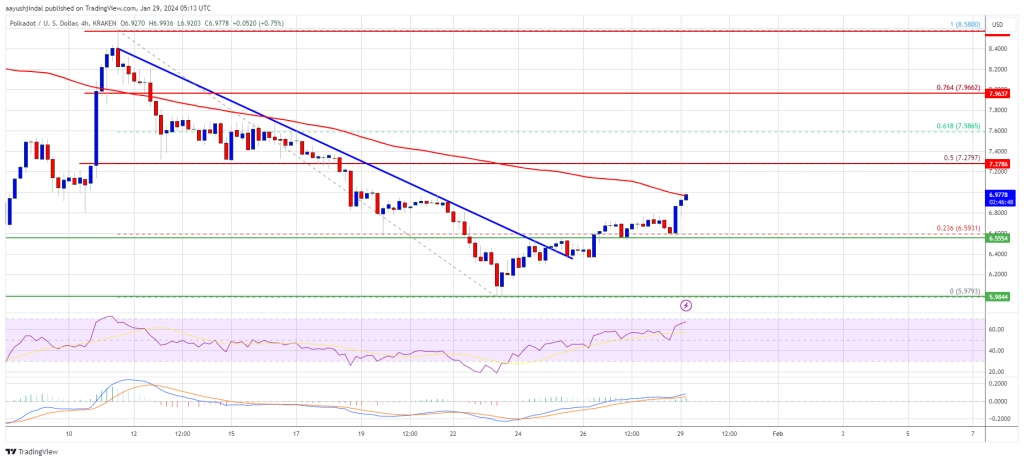
Source: DOTUSD on TradingView.com
A successful break above $7.28 could start another strong rally. In the stated case, the price could easily rally toward $8.00 in the near term. The next major resistance is seen near the $8.50 zone.
Are Dips Supported in DOT?If DOT price fails to start a fresh increase above $7.28, it could start a fresh decline. The first key support is near the $6.60 level.
The next major support is near the $6.00 level, below which the price might decline to $5.65. Any more losses may perhaps open the doors for a move toward the $5.32 support zone.
Technical Indicators
4-Hours MACD – The MACD for DOT/USD is now gaining momentum in the bullish zone.
4-Hours RSI (Relative Strength Index) – The RSI for DOT/USD is now above the 50 level.
Major Support Levels – $6.60, $6.00 and $5.65.
Major Resistance Levels – $7.28, $8.00, and $8.50.
Why this matters
This cryptocurrency story adds another data point to the current market tape and is useful when read alongside nearby source coverage.
Original source
Read on NewsBTCRelated market context

XRP Price Prediction: Chart Mirroring 2016, Targeting $23
XRP trades at around the $1.50 price level, slightly down, but a long-range chart comparison points to a $23 prediction. The resem...

CFTC makes its biggest move yet to bring offshore crypto trading back to the US
The Commodity Futures Trading Commission (CFTC) is offering US crypto exchanges a federal route to retail leverage as Congress rem...

Microsoft Copilot AI Predicts Chainlink (LINK) Could Hit $100 in 2026
Microsoft Copilot AI predicts that in a world where Chainlink becomes the backbone of a major global settlement system, such as SW...

Mark Zuckerberg Meta AI Predicts Double-Digit XRP Price by 2026
Currently priced at approximately $1.50, Mark Zuckerberg’s Meta AI predicts that XRP could surge above $10 this year, a gain of ar...

Kaiko report finds EUR fiat pairs dominate euro crypto trading volumes
The dominance of EUR fiat pairs in euro crypto trading highlights a preference for direct transactions, impacting stablecoin adopt...

Near Protocol ETF Puts NEAR Back on Institutional Investors’ Radar
Bitwise Investment Advisers’ Bitwise NEAR Protocol ETF, ticker NRR, is designed to hold NEAR directly and seek additional tokens t...